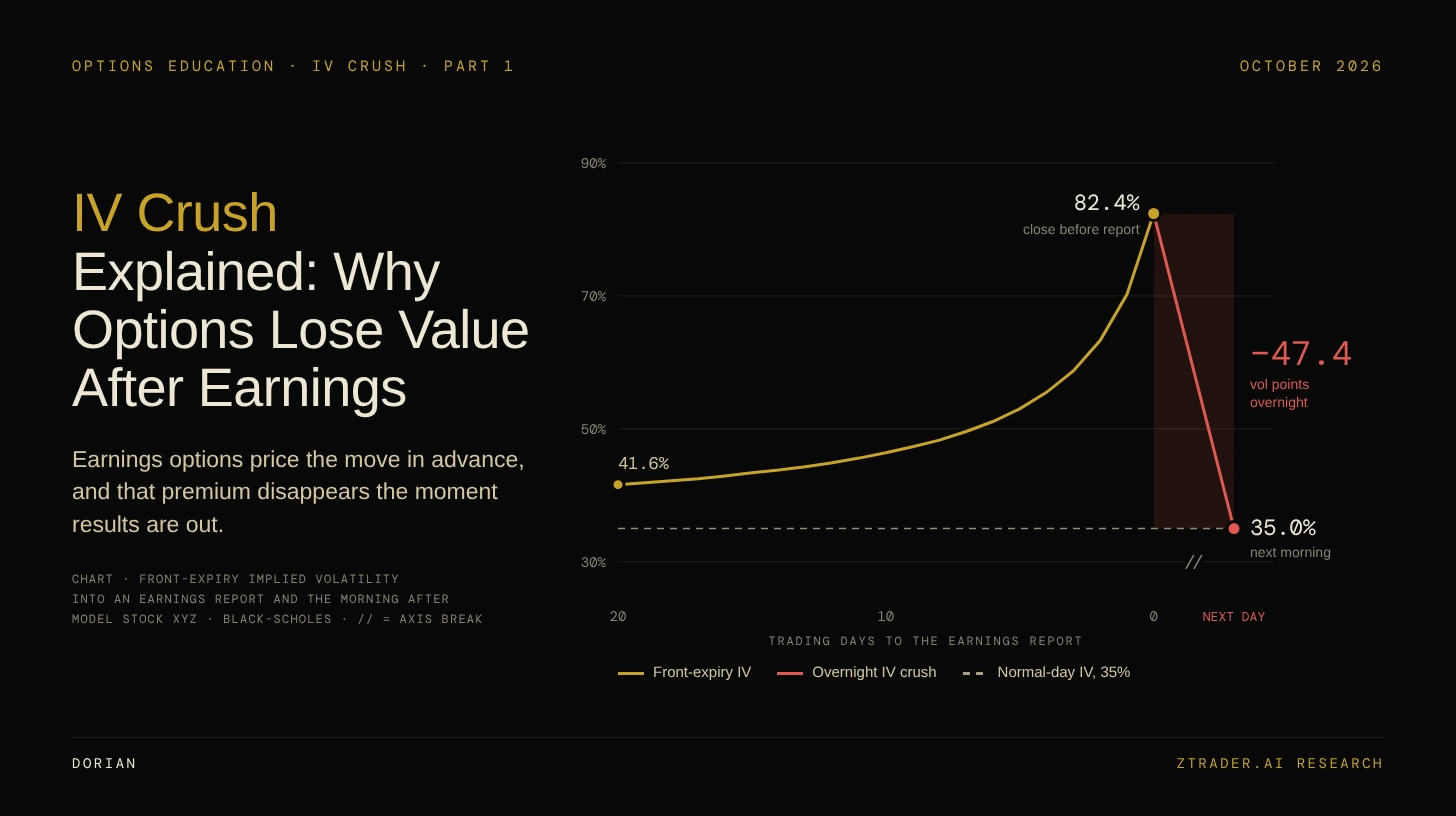
IV Crush Explained: Why Options Lose Value After Earnings
Earnings options price the move in advance, and that premium disappears the moment results are out.
IV CRUSH: THE BASICS
What it is
IV crush is the sharp drop in implied volatility right after a scheduled event, usually an earnings report. Implied volatility (IV) is the volatility number backed out of an option’s market price. When the report is out, the uncertainty is gone, and so is the extra volatility priced into the options.
There are Two formulas you need
- Premium lost to the crush ≈ Vega × IV drop. Vega is how many dollars an option gains or loses for each 1-point change in IV.
- Implied move ≈ ATM straddle price ÷ stock price. The ATM straddle is one at-the-money call plus one at-the-money put in the expiry right after the report. tastylive’s rule of thumb uses 85% of the straddle instead.
Worked example
XYZ trades at $100.
The 2-day ATM straddle costs $5.85, so the implied move is ±5.85% (±4.98% on the 85% rule).
The ATM call has a vega of $0.0355 per vol point. IV falls 47.4 points overnight. That is about $1.68 per share, or $168 per contract, lost from IV alone.
Who wins and who loses
Which option structures lose and gain when IV collapses after earnings
Net vega sets the direction, except calendars: the front expiry's IV falls far more than the back. ▼ red = value falls, ▲ green = value rises, ◆ gold = partly offset.
When it matters most
IV crush is an event effect. It hits hardest when the expiry holding the report trades at a much higher IV than the expiries behind it.
You bought options calls into earnings. The company estimate beat. The stock opened higher. Your calls still opened red.
That outcome confuses new traders every quarter, and it is pure mechanics. The options you bought carried a price for the earnings move before the move happened. Once the report hits, that price comes out, whether the stock moves or not.
This matters more now than it did a few years ago.
More than half of single-stock options volume now sits in contracts that expire within two weeks, according to John Marshall of options manager Carrick Lane, as reported by The Wall Street Journal in October 2026.
Those short-dated contracts are exactly where the crush lands hardest. In the second quarter, Nvidia and Tesla each took about 9% of all single-stock options volume, per Cboe. Third-quarter earnings season is starting now.
By the end of this piece you will be able to achieve four things:
- Read the implied move straight off the option chain.
- See which expiry and which strikes carry the crush.
- Price five common positions across six outcomes before you enter.
- Explain why a high win rate on earnings trades says nothing about profit.
For every number below comes from one model stock, XYZ.
Why a model and not a real ticker? Real chains mix the crush with skew, bid-ask spreads and dividends. The model strips those out, so you see the crush alone. XYZ trades at $100.
On a normal day its IV is 35%.
For the report, the market prices a one-day move with a 7% standard deviation.
Every option is priced with Black-Scholes. Real tickers will show different numbers. The mechanics are the same.
I. WHERE THE EARNINGS PREMIUM SITS ON THE CURVE
Let’s start with the options term structure.
Term structure is the line you get when you plot ATM implied volatility for each expiry, from the nearest to the furthest. On a quiet stock the line slopes gently upward. That curve shape is called contango.
When the stock earnings flip and the expiry holding the report trades far above the rest. That inverted shape is called backwardation.
The expiry that holds the report carries most of the IV crush
ATM implied volatility by expiry, the close before earnings vs. the next morning. Every expiry includes the report.
Let’s read the gold line, it shows the market closing before the earning report.
- The 2-day expiry trades at 82.4%.
- The 7-day expiry drops to 53.0%.
- The 22-day expiry sits at 41.6%.
- The 62-day expiry is barely touched at 37.5%.
Now we should read the dashed line.
That is the next morning.
Every expiry falls back to 35%, the stock’s normal IV.
The front expiry loses 47.4 vol points overnight.
The 62-day expiry loses 2.5.
Why is the option data so uneven?
The report shows only one day.
In a 2-day option, that day is half of the option’s life. In a 62-day option, it is one day out of 62. The event is the same size in both. Its weight is very different. So the crush concentrates where the event weighs most: the first expiry after the report.
II. HOW ONE DAY GETS PRICED INTO A WHOLE EXPIRY
Option traders split every expiry into two parts: normal days and the earnings day. The tool they use is variance. Variance is volatility squared, scaled by time. Unlike volatility, it adds up cleanly day by day.
Run the numbers on the 2-day expiry.
- One normal trading day. At 35% IV, one standard deviation on a normal day is about 2.2%. That day adds 0.000486 of variance.
- The earnings report day. The market prices a 7% standard deviation. That day adds 0.0049 of variance.
- Total. Together that is 0.005386. The earnings day is 91% of it.
Now convert the total back into an annual IV over 2 trading days. Say You get 82.4%. That is the number on your screen.
Want to see the earnings day by itself? Annualize that single day and you get an event volatility of about 111%. That figure lives inside every expiry that holds the report. It just gets diluted more in the longer ones.
So is 82% IV expensive?
Not necessarily.
Watch what happens to the same option as the report gets closer.
IV doubles into the report while the straddle gets cheaper
Same option, stock held at $100. The earnings-day variance stays fixed while the normal days run off, so IV climbs as the dollar price drops.
Twenty trading days out, the straddle on this expiry trades at $9.80 with IV at 41.6%.
On the earning report day, IV has nearly doubled to 82.4%.
The straddle now costs $5.85.
That is 40% cheaper.
How can both be true?
The earnings variance stays fixed. The normal days keep running off. Fewer days share the same big event, so the IV number climbs. Meanwhile the dollar price falls, because there is less total time left to move.
The takeaway for your screen:
IV is an annualized rate.
To judge whether earnings options are rich or cheap, compare the implied move in dollars or percent with the move you actually expect. The IV level alone cannot answer that.
III. THE MORNING AFTER, STRIKE BY STRIKE
Now hold the stock still.
The report comes out, XYZ opens flat at $100, and IV snaps back to 35%.
What does each call lose overnight?
Short-dated, out-of-the-money calls lose the most overnight
Change in call value from the close before earnings to the next morning, with the stock unchanged at $100. Only IV and one day of time move.
The pattern is clean.
- The 2-day ATM call drops from $2.93 to $0.88. That is a 70% loss with zero move in the stock.
- The 2-day calls at 105 and above lose 99% to 100%. They were pure event premium. Without a move, they are worth nothing.
- The 2-day call at 85 loses 0.2%. It is deep in the money. Almost all of its value is intrinsic, and intrinsic value has no IV component.
- The 62-day ATM call loses 7.3%. More time means more normal days, and the event was only a small part of its price.
Check the vega formula against the 2-day ATM call.
Vega of $0.0355 times a 47.4-point drop gives about $1.68. The actual loss is $2.05. The formula covers about 82% of it. One day of time decay accounts for the rest.
So the crush varies from option to option.
Two things decide its size.
How close is the expiry to the report?
How much of the option’s price is extrinsic value?
Extrinsic value is everything above intrinsic value. Short-dated and out-of-the-money options are almost all extrinsic, so they take the full hit.
IV. SCENARIOS: FROM A FLAT OPEN TO A 2× GAP
Now let the stock move. The setup is the same as above: XYZ at $100, front straddle at $5.85, implied move ±5.85%.
Each position is one contract, opened at the close before the report and marked the next morning after IV resets to 35%.
Let us look at the following five positions:
- Long call: buy the 2-day 100 call for $293.
- Long straddle: buy the 2-day 100 call and 100 put for $585.
- Short straddle: sell the same straddle for a $585 credit.
- Short iron condor: sell the 94 put and 106 call, buy the 89 put and 111 call, for a $127 credit. Maximum loss is $373.
- Long call calendar: sell the 2-day 100 call and buy the 22-day 100 call, for a $197 debit.
The columns show the overnight stock move as a multiple of the implied move. Flat means no move. +1× means up exactly 5.85%. +2× means up 11.71%. The −1× column shows a drop of 5.85%.
What each position makes or loses the morning after the report
XYZ at $100, front straddle $5.85 (implied move ±5.85%). P&L per contract of 100 shares after IV resets to 35%. Green = profit, red = loss.
Long call
You need XYZ up 2.82% just to break even. That is about half the implied move, because the call costs about half the straddle. At a flat open you lose $205, or 70% of your premium. Drop 5.85% and the full $293 is gone. The call only pays well if the stock beats the implied move in your direction.
Long straddle
The straddle breaks even when the stock moves exactly the implied move, in either direction. That is no coincidence: the straddle price is the implied move, and with one day left the remaining time value is only pennies. At a flat open you lose $410. At 2× you make $585. You are paying for a move bigger than the one already priced in.
Short straddle
This is the mirror image. At a flat open you make $410. At exactly 1× you make nothing. At 2× you lose $585, and there is no cap on how much worse it can get.
Short iron condor
The condor makes money from a flat open out to a full 1× move in either direction. It stays positive at +1× with $43, because the short strikes sit just beyond the implied move. At 1.5× it loses $141. The long wings cap the worst case at $373.
Long call calendar
The calendar makes its best result, $118 on a $197 debit, at a flat open. Why does it work? The short front call loses 47.4 vol points. The long 22-day call only loses 6.6 points, falling from 41.6% to 35%. The calendar is net long vega, so a uniform IV drop would hurt it. The crush is far from uniform, and that gap is the whole trade. Big moves in either direction hurt it, because both calls end up far from the strike.
The pattern across all five: every position is a bet on the size of the move relative to the implied move. Long volatility needs a move bigger than the implied move. Short volatility needs one smaller.
The crush is already in the price. The stock move decides the result.
V. WIN RATE VERSUS PAYOFF
The following table shows one earning report and it comes for four times a year. So what happens if you sell the straddle every quarter?
To test that number, the model runs XYZ through simulated reports. Real earnings reactions have fat tails: most moves are small, and a few are huge.
The simulation uses a Student-t distribution to capture that shape. It is sized so the straddle is fairly priced on average. In other words, the seller has no edge built in.
Short straddles win most quarters and still average zero
Short front straddle on XYZ ($585 credit) across 40 simulated reports. Fat-tailed reactions (Student-t, df = 4), sized so the straddle is fairly priced.
Across 40 simulated reports:
- 29 reports are profitable. That is a 72.5% win rate.
- The average win is $245. The average loss is $532.
- The worst single report loses $3,348, more than five times the credit collected.
Run the same setup over 200,000 reports and the long-run numbers settle. The win rate is 65.1%. The average win is $274. The average loss is $511. The average result per report is roughly $0.
Read that number again. The seller wins about two quarters out of three and still earns nothing over time. Wins are small and frequent. Losses are rare and large. They cancel out.
Real data shows the same tension.
In a 2015 tastylive study, stocks stayed inside their expected move about 68% of the time around earnings. That sounds like easy money for sellers.
Yet EarningsWatcher data shows Tesla’s peak intraday earnings move beat its implied move in 12 of 17 reports since 2022, as of October 14, 2026.
Note that the second figure uses the peak intraday move, which runs larger than the close-to-close move. The two studies use different stocks and different measures. They point to the same lesson. Win rate alone tells you nothing about profit until you know the size of the wins and the losses.
Where does a real edge come from, then?
Mostly from a gap between the implied move and what the stock actually tends to do. If the straddle prices 6% and the stock has averaged 4% on its last ten reports, sellers have an edge. If it has averaged 9%, buyers do. The crush by itself gives neither side an edge.
VI. YOUR OPTIONS PRE-TRADE CHECKLIST
Run these five steps before any earnings trade.
- Read the implied move. Divide the ATM straddle in the first expiry after the report by the stock price.
- Check the term structure. Compare the front expiry’s IV with the next one. The bigger the gap, the more premium the crush will remove.
- Pull the stock’s own history. Look at its actual earnings moves over the last 8 to 12 reports. Compare the median and the largest moves with today’s implied move.
- Match the structure to the gap. If the implied move is well above history, defined-risk short-volatility structures fit. If it is well below, long straddles or directional longs fit. If the two are close, the options are fairly priced and there is no volatility edge.
- Price the outcomes before you click. Mark your position at a flat open, a 0.5× move, a 1× move and a 2× move. If the 2× result is a loss you cannot carry, the size is wrong.
QUESTIONS OPTIONS TRADERS ASK
What is IV crush?
IV crush is the sharp fall in implied volatility right after a scheduled event such as earnings. Options price in the uncertainty before the report. Once results are public, that premium comes out, and option prices drop even if the stock does not move.
How much does IV drop after earnings?
It depends on the expiry. In the XYZ model, the expiry right after the report falls from 82.4% to 35%, a 47.4-point drop. The 62-day expiry falls only 2.5 points. The closer the expiry is to the report, the bigger the drop.
How do you calculate the expected move for earnings?
Divide the price of the at-the-money straddle in the first expiry after the report by the stock price. On a $100 stock, a $5.85 straddle implies a move of about ±5.85%. tastylive’s shortcut uses 85% of the straddle, which gives about ±5%.
Can you profit from IV crush?
Short straddles, iron condors and long calendars gain from the crush, but only if the stock moves less than the implied move. Calendars are net long vega, yet they still gain, because the front expiry’s IV falls far more than the back expiry’s. If the stock moves more, the price move outweighs the crush. Over many reports, the edge comes from implied moves that run above actual moves.
Does IV crush affect all options equally?
No. Short-dated and out-of-the-money options lose the most, because nearly all of their value is extrinsic. In the XYZ model, 2-day out-of-the-money calls lose 99% to 100% with the stock flat, while a deep in-the-money call loses 0.2%.
PUTTING THE OPTION CHAIN TOGETHER
The whole mechanism can be summarized as following:
The earnings day carries a large, fixed amount of variance.
The variance lands mostly in the first expiry after the report, then its IV spikes.
The straddle in that expiry turns the spike into a price: the implied vol move.
The morning after, the variance is spent and IV falls back to normal. Short-dated and out-of-the-money options lose almost everything.
Who wins is decided by one comparison: did the stock move more or less than the implied move?
High win rates do not change that math.
Only a persistent gap between implied and actual moves does.
IN SUMMARY, HOW TO TRADE IV CRUSH?
This is what you do before every stcok earning report:
- Read the implied move.
- Find the expiry carrying the event.
- Check the stock’s history.
- Pick the structure that fits the gap.
- Price the 2× outcome before you pull the trigger.
SOURCES
tastylive, Expected Move definition: https://tastylive.com/definitions/expected-move
tastylive, Earnings and Expected Move study (April 6, 2015): https://tastylive.com/shows/market-measures/episodes/earnings-expected-move-04-06-2015
The Wall Street Journal, Krystal Hur and Hannah Erin Lang, Frenzied Stock-Options Trading Shows Individual Investors Are Still Hungry for Risk (October 2026), summary: https://johnlothiannews.com/frenzied-stock-options-trading-shows-individual-investors-are-still-hungry-for-risk/
BigGo Finance, US retail options notional volume (citing Carrick Lane): https://finance.biggo.com/news/4ac4ae58-e09b-4ef1-b3f4-4fa1ae138065
EarningsWatcher, TSLA implied move history: https://earnings-watcher.com/wiki/tsla-implied-move
Cboe, State of the Options Industry Q2 2026: https://www.cboe.com/insights/posts/state-of-the-options-industry-options-market-continued-to-break-records-in-q-2-2026
Moontower, Extracting earnings from a vol term structure: https://moontower.substack.com/p/how-an-option-trader-extracts-earnings
Model note: XYZ is a hypothetical stock. All charts and tables use Black-Scholes pricing with r = 0, ex-earnings IV 35% and a 7% earnings-day standard deviation. The simulation uses Student-t (df = 4) reactions, sized so the straddle is fairly priced.