Bitcoin On-Chain Analysis: The $80K Cost Basis Every ETF Holder Is Watching
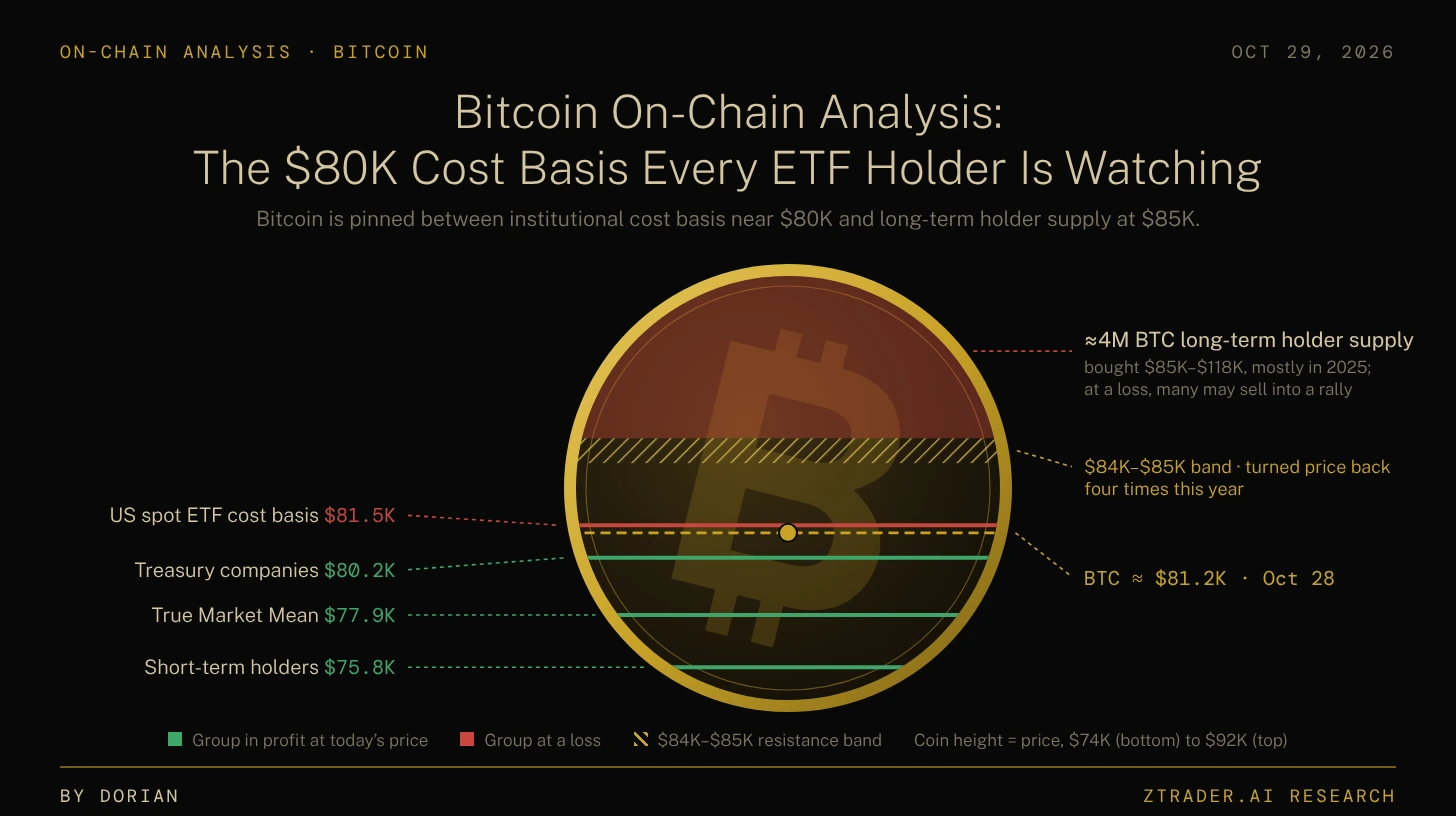
Bitcoin is pinned between institutional cost basis near $80K and long-term holder supply at $85K.
Price tells you where Bitcoin trades. The blockchain tells you who is losing money there. At $80,000, those two answers sit almost on top of each other.
Bitcoin traded near $81,000 after the Fed decision, roughly a third below its record of about $126,000 set in October 2025. The Federal Reserve held rates at 3.75% to 4% in a 10-2 vote, and both dissenters wanted an immediate hike, which keeps pressure on every risk asset you own. Most traders read this market through a candlestick chart, but the public ledger gives you something a chart never can: the price at which every coin last changed hands. From that record you can estimate where each group of holders breaks even, and right now the US spot ETFs and the listed treasury companies break even within about $1,000 of the current price, while the investors who bought in 2025 hold a block of about 4 million BTC that starts just above $85,000. That cluster is the reason Bitcoin keeps stalling in the same place, and it is the reason on-chain data matters more this month than any trendline.
IHOW TO READ A COST BASIS
Before the levels make sense, you need three terms that every on-chain desk uses, because the rest of this piece is built on them.
Realized Price: The Market's Average Entry
What is realized price? It is the average price at which every Bitcoin last moved on-chain. In plain English, it is the average entry of the entire market. Because the ledger is public, analysts can split that average by holder group and calculate a separate break-even for each one.
Short-Term and Long-Term Holders: The 155-Day Line
On-chain analysts split holders by how long their coins have sat still. Coins that moved within the last 155 days belong to short-term holders, the newer buyers most likely to sell on any given day. Coins that have not moved for longer than 155 days belong to long-term holders, the investors least likely to sell. When you hear "STH cost basis" or "LTH cost basis", it means the average entry price of each group.
True Market Mean: The Active Investor's Break-Even
Glassnode's True Market Mean is the average cost basis of active investors. It focuses on active investors rather than every coin ever mined, so it gives a cleaner read on what the people actually trading this market paid.
Why Break-Even Levels Act as Support and Resistance
Holders behave differently depending on whether they are in profit. When price falls back to where a group bought, the buyers who still believe in the trade tend to defend their entry and add. When price rallies back to where an underwater group bought, many of them sell to get their money back. That is why a cost basis tends to act as support from above and resistance from below.
Read the market this way and every price level stops being a line on a chart and becomes a crowd of real holders with a real reason to act.
IIBELOW $82,000: THE INSTITUTIONS' BREAK-EVEN
With the vocabulary in place, the first thing to map is the floor, because the nearest support this cycle sits at institutional cost basis.
The Ladder Under Price
Glassnode's October 28 report stacks the main cost bases below price in a tight ladder:
- US Spot ETF Cost Basis ($81.5K) This is the average price the ETFs paid for the coins they hold. Bitcoin has slipped just under it, which means the average ETF holder is now slightly underwater.
- Treasury Companies (about $80.2K) Glassnode estimates the listed Bitcoin treasury companies it tracks hold their coins at an average cost of about $80.2K, just under the ETF line.
- True Market Mean ($77.9K) Price has stayed above the active investor's break-even through both October sell-offs.
- Short-Term Holder Cost Basis ($75.8K) This is the next support if the True Market Mean gives way.
- Strategy ($75,446) The largest corporate holder owns 848,517 BTC at an average cost of $75,446, according to its October 26 SEC filing.
Glassnode treats a daily close below $80K as the point that puts both the average ETF holder and the average treasury company at a loss.
The Order Book Confirms the Map
The on-chain levels line up with real orders on the exchange. When Bitcoin dropped to about $80K on October 15, buyers on the Binance spot book filled the bids there and then refilled them within days. The October 24 drop took those bids out again, and this time they did not come back: only $3.4M in bids remains at $80K. Buyers have moved lower, to $78K to $79K, where orders add up to about $42M, up from about $24M in mid-October.
ETF Flows Show Holders Sitting on Their Hands
ETF flows tell you whether institutional demand is still arriving at these prices. The funds lost $487.1M on October 7 and another $244.1M on October 8. They took in $526.6M on October 19 and $528.4M on October 21, then gave back $635.5M on October 22, the largest outflow of the month. Inflows of $110.3M on October 26 and $176M on October 27 still left October $26.1M negative through that date. Trading volume tells the same story: the ETFs have traded about $1.3B a day since May, and on October 23 volume fell to about $700M, one of the quietest sessions of the year.
Treasury Companies Have Stopped Leading the Bid
Treasury companies built their positions through a loop: purchases lifted the price, the price lifted their shares, and their shares funded more purchases. That loop depends on mNAV, the ratio of a company's market value to the value of the Bitcoin it holds. When mNAV sits above 1, selling new shares to buy Bitcoin adds Bitcoin per share. When it sits below 1, the same move dilutes shareholders. Glassnode notes that treasury buying has not returned with price, and every month since June has added less than a tenth of the peak month, November 2024. Strategy's basic mNAV stood at about 0.87 in October, according to SaylorTracker data cited by Decrypt, although measures based on enterprise value run higher. In the week of October 19 to 25 the company bought no Bitcoin at all and spent $204.9M repurchasing its STRC preferred stock instead.
The floor under Bitcoin is real, and right now existing holders defending their entry are holding it up while new money stays on the sidelines.
IIIWHERE 2025'S BUYERS ARE STILL UNDERWATER
If institutions define the floor, the ceiling belongs to the investors who bought the top of the last cycle, and their position explains why every rally this year has died in the same zone.
Four Million Coins Bought Above $85K
Long-term holders own a heavy block of about 4 million BTC bought between $85K and $118K, mostly during 2025. More than half of all long-term holder coins were bought above today's price. These holders have sat through a drawdown of more than 30% from the record, and Glassnode says many of them may sell if price recovers toward $85K and gives them a chance to exit at break-even.
The $84K to $85K Band
This band has turned Bitcoin back four times this year. It stalled rallies in May, in early September and on October 21. Bitcoin did break above it around the September high and peaked at $87.1K on September 23, but since January it has closed above the band on only five days, and never on more than three days in a row. Just above sits a second layer of supply: the cost basis of buyers from the last 6 to 12 months near $86.7K, a block of Binance sell orders between $86.5K and $87.5K, and the two largest liquidation clusters near $85K and $87K.
Long-Term Holders Are Selling, Just More Slowly
Analyst Axel Adler Jr. reports that long-term holder supply fell from 16.41 million to 16.06 million BTC between July 30 and mid-October, a reduction of 345,000 BTC or about 2%. In early October these holders reduced their balances on 13 out of 15 days, and that count has since eased to 10. Their average cost is about $48,600, which left the group with an unrealized gain of roughly 70% at the time.
Those two facts look contradictory until you separate the average from the distribution. The two readings come from different data providers, but they describe the same split. Adler's long-term holder SOPR has stayed above 1, which means the coins these holders sell are being sold at a profit. The 2025 buyers inside the same group are still underwater, and their break-even sits in the band price cannot clear.
The average long-term holder is deep in profit, but the marginal long-term holder is waiting at $85K to sell.
IVDIRTY DATA IN A PUBLIC LEDGER
Everything above depends on one assumption: that a coin moving on-chain means a coin changing owners. That assumption breaks more often than most dashboards admit.
The chain records every transaction but says nothing about why it happened. When an exchange, custodian or fund moves coins between its own wallets, the ledger stamps those coins with a new "last moved" price, even though nobody bought or sold anything. Two examples from this market show how large the distortion can get.
The $84K Band Is Partly a Wallet Shuffle
About 4.3% of all Bitcoin last moved between $84K and $85K. Most of that moved on a single day, November 22, 2025, when one large holder shifted coins between its own wallets. The cost basis heatmap therefore shows far more supply at $84K to $85K than real buyers ever paid there. Price has still respected the band as support in December and as resistance since January, so the level carries real trading history, but the size of the supply wall is overstated.
October 22: $3.7B in Profit That Nobody Took
On October 22 one entity again moved coins between its own wallets. On the standard measure, that single transfer lifted realized profit to about $3.7B and realized loss to about $1.4B in one day, although nothing was sold. Glassnode's entity-adjusted data, which nets out such internal moves, puts real profit taking at about $260M a day that week, roughly half its pace in the week of the September high. Anyone who traded the raw number would have read a wave of distribution that never happened.
Three Checks Before You Trust a Spike
Before acting on any sudden jump in an on-chain metric, run three checks:
- Look for the entity-adjusted version of the metric. If the spike disappears after internal transfers are removed, nobody actually sold.
- Check whether exchange balances or price moved with it. Real distribution usually shows up as coins arriving on exchanges and pressure on price.
- Compare the spike with its own multi-day average. One-day outliers that do not repeat are usually data events rather than behavior.
On-chain data gives you the most honest record in finance, but only after you clean it.
VTHE DEMAND SIDE OF THE MAP
Support and resistance tell you where holders will act. Demand tells you whether anyone will be there to meet them, and on that question the evidence is split.
Signs That Sellers Are Exhausted
- Realized Losses Holders have locked in smaller losses with each dip since August. At the August low, realized losses outweighed profits by about $630M in a single day. Around the October 24 drop, the largest daily net loss was about $27M, which suggests fewer holders are willing to sell at a loss.
- Exchange Reserves CryptoQuant data show exchange reserves falling from 2.726 million BTC on September 20 to 2.68 million by October 13. Traders also withdrew 14,942 BTC from exchanges around the Fed decision. Lower reserves reduce the supply ready to sell, though they do not guarantee higher prices, because coins also leave exchanges for institutional custody.
- Wallet Cohorts Glassnode's Accumulation Trend Score shows wallets holding 100 to 1,000 BTC as this month's steadiest buyers. In summer 2023, by comparison, every wallet group was reducing.
Signs That New Money Is Missing
- Stablecoin Supply Stablecoins are the cash that funds crypto purchases, and that cash pile has stopped growing. Total stablecoin supply peaked near $321B in May and stood near $306B in mid-October, about 1% lower than at the start of the year, according to DefiLlama data.
- Recovery Pace Counted from each cycle low, the 2026 rebound tracked the 2022 to 2023 recovery for about three months and then fell behind. Bitcoin is now 38% above its June low, while at the same stage in 2023 it was 75% above its low.
- Volatility One-month realized volatility, the annualized size of daily price moves, has dropped to about 25%. Since 2015, Bitcoin has been calmer on only about 5% of days, which leaves the market unusually quiet after the Fed decision.
Sellers have run out of urgency, but buyers have not yet shown up with size.
VIFIVE LEVELS THAT DECIDE THE RANGE
The map now has a floor, a ceiling and a demand picture, and together they give you a short list of levels where the on-chain story will either hold or break.
- $87.5K Glassnode's threshold for proof that demand is absorbing the overhead supply is a daily close above this level with ETF inflows repeating on rising volume.
- $85K Several daily closes in a row above $85K would turn the $84K to $85K band from resistance back into support, the first step toward that proof.
- $81.5K One daily close back above the ETF cost basis would put the average ETF holder back in profit.
- $77.9K One daily close below the True Market Mean would put the average active investor underwater.
- $75.8K The short-term holder cost basis is the next support below that, with Strategy's $75,446 average cost just underneath.
| Level | What sits there | What a daily close there signals |
|---|---|---|
| $87.5K | Binance sell orders to $87.5K; liquidation cluster and 6–12 month cost basis just below | Daily close above with ETF inflows on rising volume shows demand absorbing overhead supply |
| $85K | Top of the $84K–$85K band | Several daily closes above turn the band from resistance back into support |
| $81.5K | US spot ETF cost basis | Daily close back above puts the average ETF holder back in profit |
| $77.9K | True Market Mean | Daily close below puts the average active investor underwater |
| $75.8K | Short-term holder cost basis (Strategy $75.4K just below) | Next support if the True Market Mean gives way |
Bitcoin is stuck in this range for three reasons: the ETFs and treasury companies bought near $80K, 2025's buyers are waiting near $85K to get out, and the new money that would absorb their supply, from ETF inflows to stablecoin growth, has gone quiet. The ledger shows exactly who sits at each level, and once you strip out wallet shuffles that fake both supply walls and profit taking, it also shows that sellers are tiring while buyers are thin. Read Bitcoin through cost basis, verify every spike against entity-adjusted data, and let the closes at $85K and $80K tell you which crowd wins the range.
Data: Glassnode (The Week On-chain, October 21 and 28, 2026), CryptoQuant, Axel Adler Jr., Strategy SEC filings (October 19 and 26, 2026), US spot ETF daily flows (TFTC), DefiLlama, Federal Reserve.