Contango vs Backwardation: How to Read the Futures Curve
Contango prices surplus, backwardation prices scarcity, and roll yield pays only when spot defies the curve.
THE BASICS
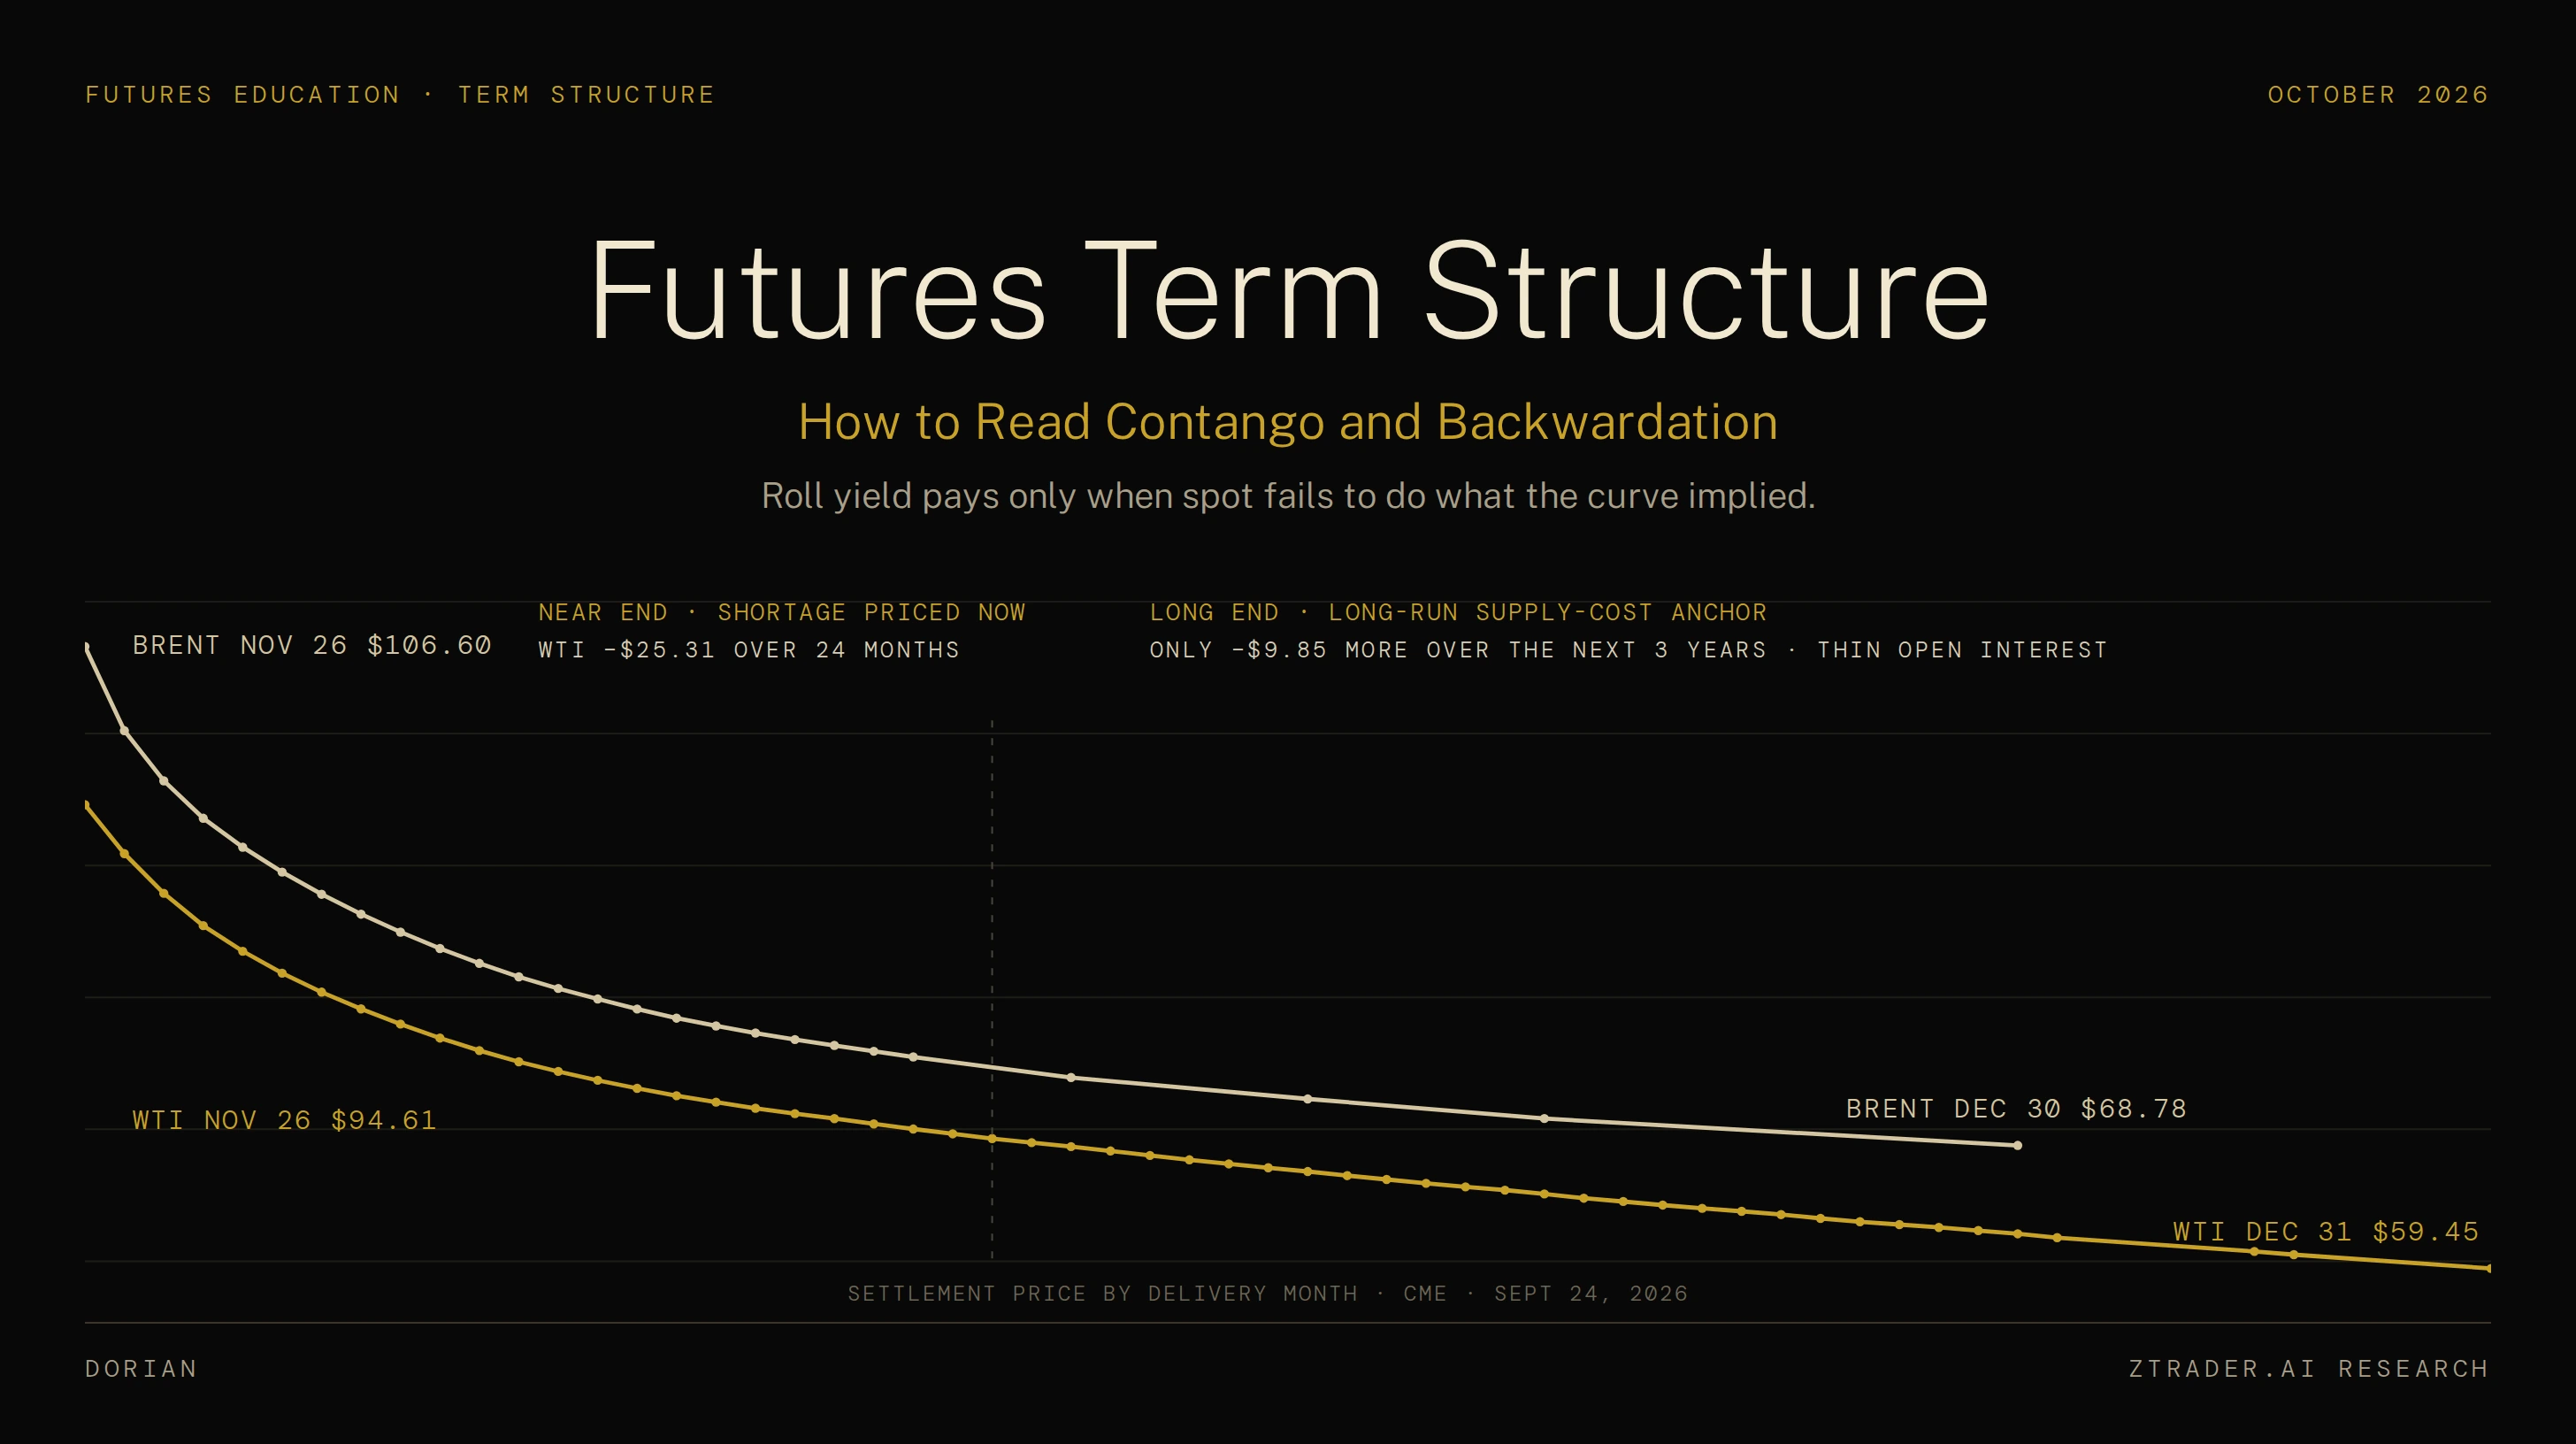
WTI and Brent Futures Curves, September 24, 2026
Term structure is the line connecting the prices of the same futures contract across its delivery months. Upward slope is contango, downward slope is backwardation, and the slope carries far more information than the price level.
- Futures excess return ≈ spot return + roll yield, and a fully collateralized position adds the interest earned on the cash sitting behind it.
- Annualized roll yield ≈ (F_near − F_far) / F_far × (12 / months between contracts), which is positive for longs in backwardation and negative for longs in contango.
- Cost of carry: F = S × e^((r + u − y) × T), where r is financing, u is storage cost and y is convenience yield, the value of holding the physical product today (dividends play the role of y in equity index futures).
Worked example: on September 8, 2026 the Brent six-month spread traded around $15 in backwardation. With the front month at $100 and the seventh month at $85, buying the $85 contract earns $15, roughly 17.6% over six months or about 35% annualized, if the front-month price holds still while the deferred contract rolls up to the front. If spot instead falls to $85, exactly as the curve implied, the roll gain and the spot loss cancel and the position earns nothing.
Roll Yield by Curve Shape and Position
| Curve shape | Slope | Long roll | Short roll | Who usually sits here |
|---|---|---|---|---|
| Contango | Deferred months above the front | Pays: sells the cheaper expiring month, buys the dearer next month | Collects: buys back cheap, re-sells dear | Long-only commodity funds and long-volatility ETPs on the paying side; storage operators and short-vol sellers collecting |
| Backwardation | Deferred months below the front | Collects: sells the dearer expiring month, buys the cheaper next month | Pays: buys back dear, re-sells cheap | Producers hedging future output on the paying side; speculative longs collecting the premium |
| Flat | Little difference between months | ≈ 0 | ≈ 0 | Return comes from spot moves and collateral interest alone |
On March 31, 2026 the Brent six-month spread hit a record backwardation of more than $37 per barrel, with Gulf exports choked off by the war with Iran. Traders who read that as the textbook bullish signal and bought the front month paid for it within days, because the April 7 ceasefire sent front-month futures and the spread to four-week lows, and by the first days of July the same spread had slipped into a small contango of around 18 cents. Then the ceasefire collapsed, and by mid-September the spread was back above $20 while physical Forties cargoes changed hands above $135. Every number in that sequence is a term-structure number, and none of it fits the one-line rule that most explainers teach.
I. HOW TO READ A FUTURES CURVE
Spreads before levels
Flat price is trader shorthand for the outright price of one futures contract quoted on its own, such as front-month Brent at $106.60 on September 24, 2026. Spread is its counterpart, the difference between two contracts on the same curve. Flat price describes a level and says nothing about the curve's shape, so it has no connection to a flat curve.
- Flat price blends every driver at once, from the dollar to recession risk to headlines, while the spread between two delivery months cancels most of those shared drivers and isolates the part that comes from near-term supply and demand for the physical product.
- Professionals track three spreads at minimum: the prompt spread (first month minus second), the six-month spread (first minus seventh), and the twelve-month spread, because prompt spreads react to logistics within days while longer spreads move with inventory balances over quarters.
- Every spread needs a baseline before it means anything. Refinitiv's long-run average for the Brent six-month spread is only about $0.20 per barrel, and anything above $5 has historically marked a significant squeeze, which puts the 2026 peak of $37 at more than seven times that threshold.
Mixed shapes
- Curves rarely slope one way from end to end, and seasonal markets such as grains and natural gas routinely show backwardation in the front months against contango in the back, so the full strip has to be read before the shape gets a label.
II. WHERE THE SHAPE COMES FROM
Financial futures
Equity index, Treasury and gold futures sit on a curve pinned by arbitrage. For S&P 500 futures, fair value is roughly S × (1 + (r − d) × t). With the index at 6,500, financing at 4% and a dividend yield of 1.3%, a three-month contract should trade about 44 points above spot. When the basis drifts away from that number, the gap measures funding stress or one-sided hedging demand rather than any view on where the index is heading.
Physical commodities
Physical markets add storage cost and convenience yield, and the two sides of the curve behave very differently. When inventories are ample, convenience yield is small and the curve sits in contango, but that contango is capped at roughly the full cost of storage, since anyone can buy spot, sell the deferred contract and store the barrels for a locked-in profit. When inventories are scarce, convenience yield can rise without limit, because no arbitrage lets anyone deliver barrels that do not exist yet. Contango has a ceiling and backwardation has none, which is why the 2026 Brent spread could reach $37 while contango, as long as tank space is available, stays bounded by storage costs that run roughly $0.50 to $2 per barrel per month.
Oil spends more time on the backwardated side than most traders assume. CME Group's study of the WTI front-month versus six-month spread since 1985 found contango about 42% of the time and backwardation about 58%.
Volatility futures
VIX futures have no spot to buy and nothing to store, so no carry arbitrage disciplines the curve. Its shape comes from expected volatility plus the premium buyers pay for protection, and by Eco3min's count the curve sat in contango on roughly 85% of trading days between 1990 and 2025. The full mechanics of trading that curve are covered in The VIX Playbook.
Brent Six-Month Calendar Spread Through the 2026 War
III. ROLL YIELD AND WHO COLLECTS IT
The decomposition
Roll yield is the gain or loss from a contract converging toward spot as it approaches expiry, and from replacing it with the next contract along the curve. Over long holding periods it dominates futures returns. Research published in The Hedge Fund Journal showed that unless spot has a strong trend, the cumulative roll adjustment is the main driver of what a futures position earns, which is why two investors with the same view on oil can end a year with very different results depending on which months they held.
The catch most explainers skip
If futures prices were unbiased forecasts of future spot, backwardation would simply predict falling spot, and the long's roll gain would be eaten exactly by the spot decline, leaving zero excess return. Roll yield therefore behaves as a risk premium, paid by hedgers who need to lock in prices to speculators willing to carry the risk, and it shows up in returns only to the extent that spot fails to converge to where the curve pointed. CME's historical data back this up on average, with long positions during backwardation generally gaining and long positions during contango generally losing. The March 2026 Brent spread shows the other side of that average: the $37 backwardation priced a steep fall in prompt barrels, front-month futures dropped to four-week lows within days of the April 7 ceasefire, and by mid-June the spread had shrunk to about $4. Buyers who counted the $37 as income to be collected were reading a price forecast as a coupon.
Futures Return Decomposition: Spot Return, Roll Yield and Collateral Yield
| Component | What drives it | Spot holds at $100 | Spot falls to $85 |
|---|---|---|---|
| Spot return | Change in the front-month price | $0 | −$15 |
| Roll yield | Deferred contract converging to the front | +$15 | +$15 |
| Collateral yield | Interest on cash backing the position | + T-bill rate | + T-bill rate |
| Futures excess return | Sum of spot return and roll yield | +$15 (≈35% annualized) | $0: the curve was right |
IV. READING INVENTORIES AND POSITIONING OFF THE CURVE
- Spreads track inventories relative to normal, and they often move before flat price does, because physical buyers short of barrels bid the prompt month long before the back months reprice. The EIA estimates global oil inventories fell by about 400 million barrels in 2026 through August, and the steep Brent backwardation is the price-side record of that drawdown.
- Physical premiums sit one layer below futures spreads. In early April, Dated Brent traded more than $25 per barrel above the front-month Brent futures contract, a gap that is normally narrow, which showed the shortage was sharpest in cargoes loading within days.
- In volatility markets the same logic reads positioning rather than inventory. The steeper and longer VIX contango persists, the more short-volatility exposure has accumulated to collect it, and the larger the forced buying when the curve inverts.
- The cleanest stress gauge in equities is the ratio of VIX to VIX3M, with readings above 1.0 marking backwardation, short-dated protection priced above three-month protection, and acute hedging demand.
V. TRADING THE SLOPE
Calendar spreads
Buying the near month and selling a deferred month is a pure bet on tightening that holds up even when flat price falls, provided the front falls less than the back. When the US–Iran ceasefire came under strain in early July 2026, the Brent September–October spread swung from a 40-cent contango to more than 70 cents of backwardation in a week, a move worth over $1,100 per 1,000-barrel contract with no directional exposure to crude.
Roll drag in funds and ETPs
Products that hold front-month futures pay the curve's slope every month. Long-only oil funds bleed in contango, and long-volatility ETPs such as VXX lose to the roll on most days for the same reason. Some commodity funds use optimized roll rules, choosing whichever contract offers the best annualized roll yield instead of mechanically rolling into the next month, to reduce the drag.
Carry harvesting
Systematic strategies that sell the front of a contango curve or buy the back of a backwardated one collect roll yield as a steady return stream. The return is real, and so is the tail it is paid for, because the same curve that pays out smoothly for months can invert in a single session.
Implied Annualized Roll Yield Along the WTI Curve, September 24, 2026
Curve Regime Playbook: Shape, What It Prices, Trade, Tail Risk
| Regime | What it prices | Typical trade | Tail risk | Episode |
|---|---|---|---|---|
| Steep backwardation | Physical scarcity; high convenience yield; inventories drawing | Long prompt vs short deferred spread; long deferred to collect roll-down | Supply returns faster than priced and the front collapses | Brent spread >$37 on Mar 31, 2026, contango by early July |
| Mild contango | Ample supply; carry ≈ financing plus storage | Cash-and-carry storage; short front vs long deferred | Sudden disruption flips the front into backwardation | Brent one-month spread from 40¢ contango to 70¢+ backwardation in a week, July 2026 |
| Super-contango | Storage running out | Avoid front-month longs; ETPs move down the curve | Expiring contract settles below zero | WTI May 2020 settled −$37.63 on Apr 20, 2020 |
| VIX contango | Protection premium in calm markets | Short front VIX futures, roll into the next month | One-day inversion wipes out months of carry | Feb 5, 2018: VIX 17.31 → 37.32, VIX/VIX3M 1.33, XIV terminated |
| VIX backwardation | Acute near-term hedging demand | Reduce short-vol size; long-vol carry turns positive | Stress fades and the inversion snaps back | VIX/VIX3M > 1.0 episodes typically last days |
VI. LIMITS OF THE CARRY MODEL
When storage runs out
The storage cap on contango assumes storage is available. On April 20, 2020, with storage at the Cushing delivery point filling fast and most of the remaining space already leased, the May WTI contract settled at −$37.63 the day before expiry, while the June contract settled at $20.43. The arbitrage that normally limits contango required somewhere to store crude, and once that space was out of reach the cap disappeared with it. USO, which had held front-month contracts for 14 years, shifted its holdings into later months and carried out a 1-for-8 reverse split on April 28.
When the short side gets crowded
On February 5, 2018, the VIX more than doubled in a single session, from 17.31 to 37.32, and the VIX/VIX3M ratio reached 1.33. XIV, one of the two largest inverse-VIX notes, lost about 96% of its value by the end of the after-hours session and was terminated by its issuer, Credit Suisse. Years of contango income had built a position that could not survive one day of inversion.
When the print is wrong
Intraday quotes and settlement prices can disagree on whether a curve has flipped. Even data publishers have reported a backwardation signal off a same-day print that the official settlement later erased, so any rule built on curve shape should run on settlements.
VII. READING ANY CURVE IN FIVE STEPS
Reading a futures curve comes down to five steps. Start with the spread rather than the price, and compare it with its own long-run baseline before calling it tight or loose. Identify which force sets the shape: financing and dividends for financial futures, storage against convenience yield for physical commodities, and the protection premium for volatility. Remember the asymmetry, since contango is capped by the cost of storage while backwardation has no cap, which is why scarcity produces far larger spreads than surplus whenever tank space is available. Treat roll yield as a premium that pays only when spot fails to converge to where the curve pointed, and keep in mind that the model breaks at the edges, when storage runs out or when one side of the trade grows crowded.
Sources: EIA Short-Term Energy Outlook (September 2026) and Today in Energy; CME Group economic research; John Kemp, Best in Energy; Cboe; Refinitiv; The Hedge Fund Journal; Eco3min.