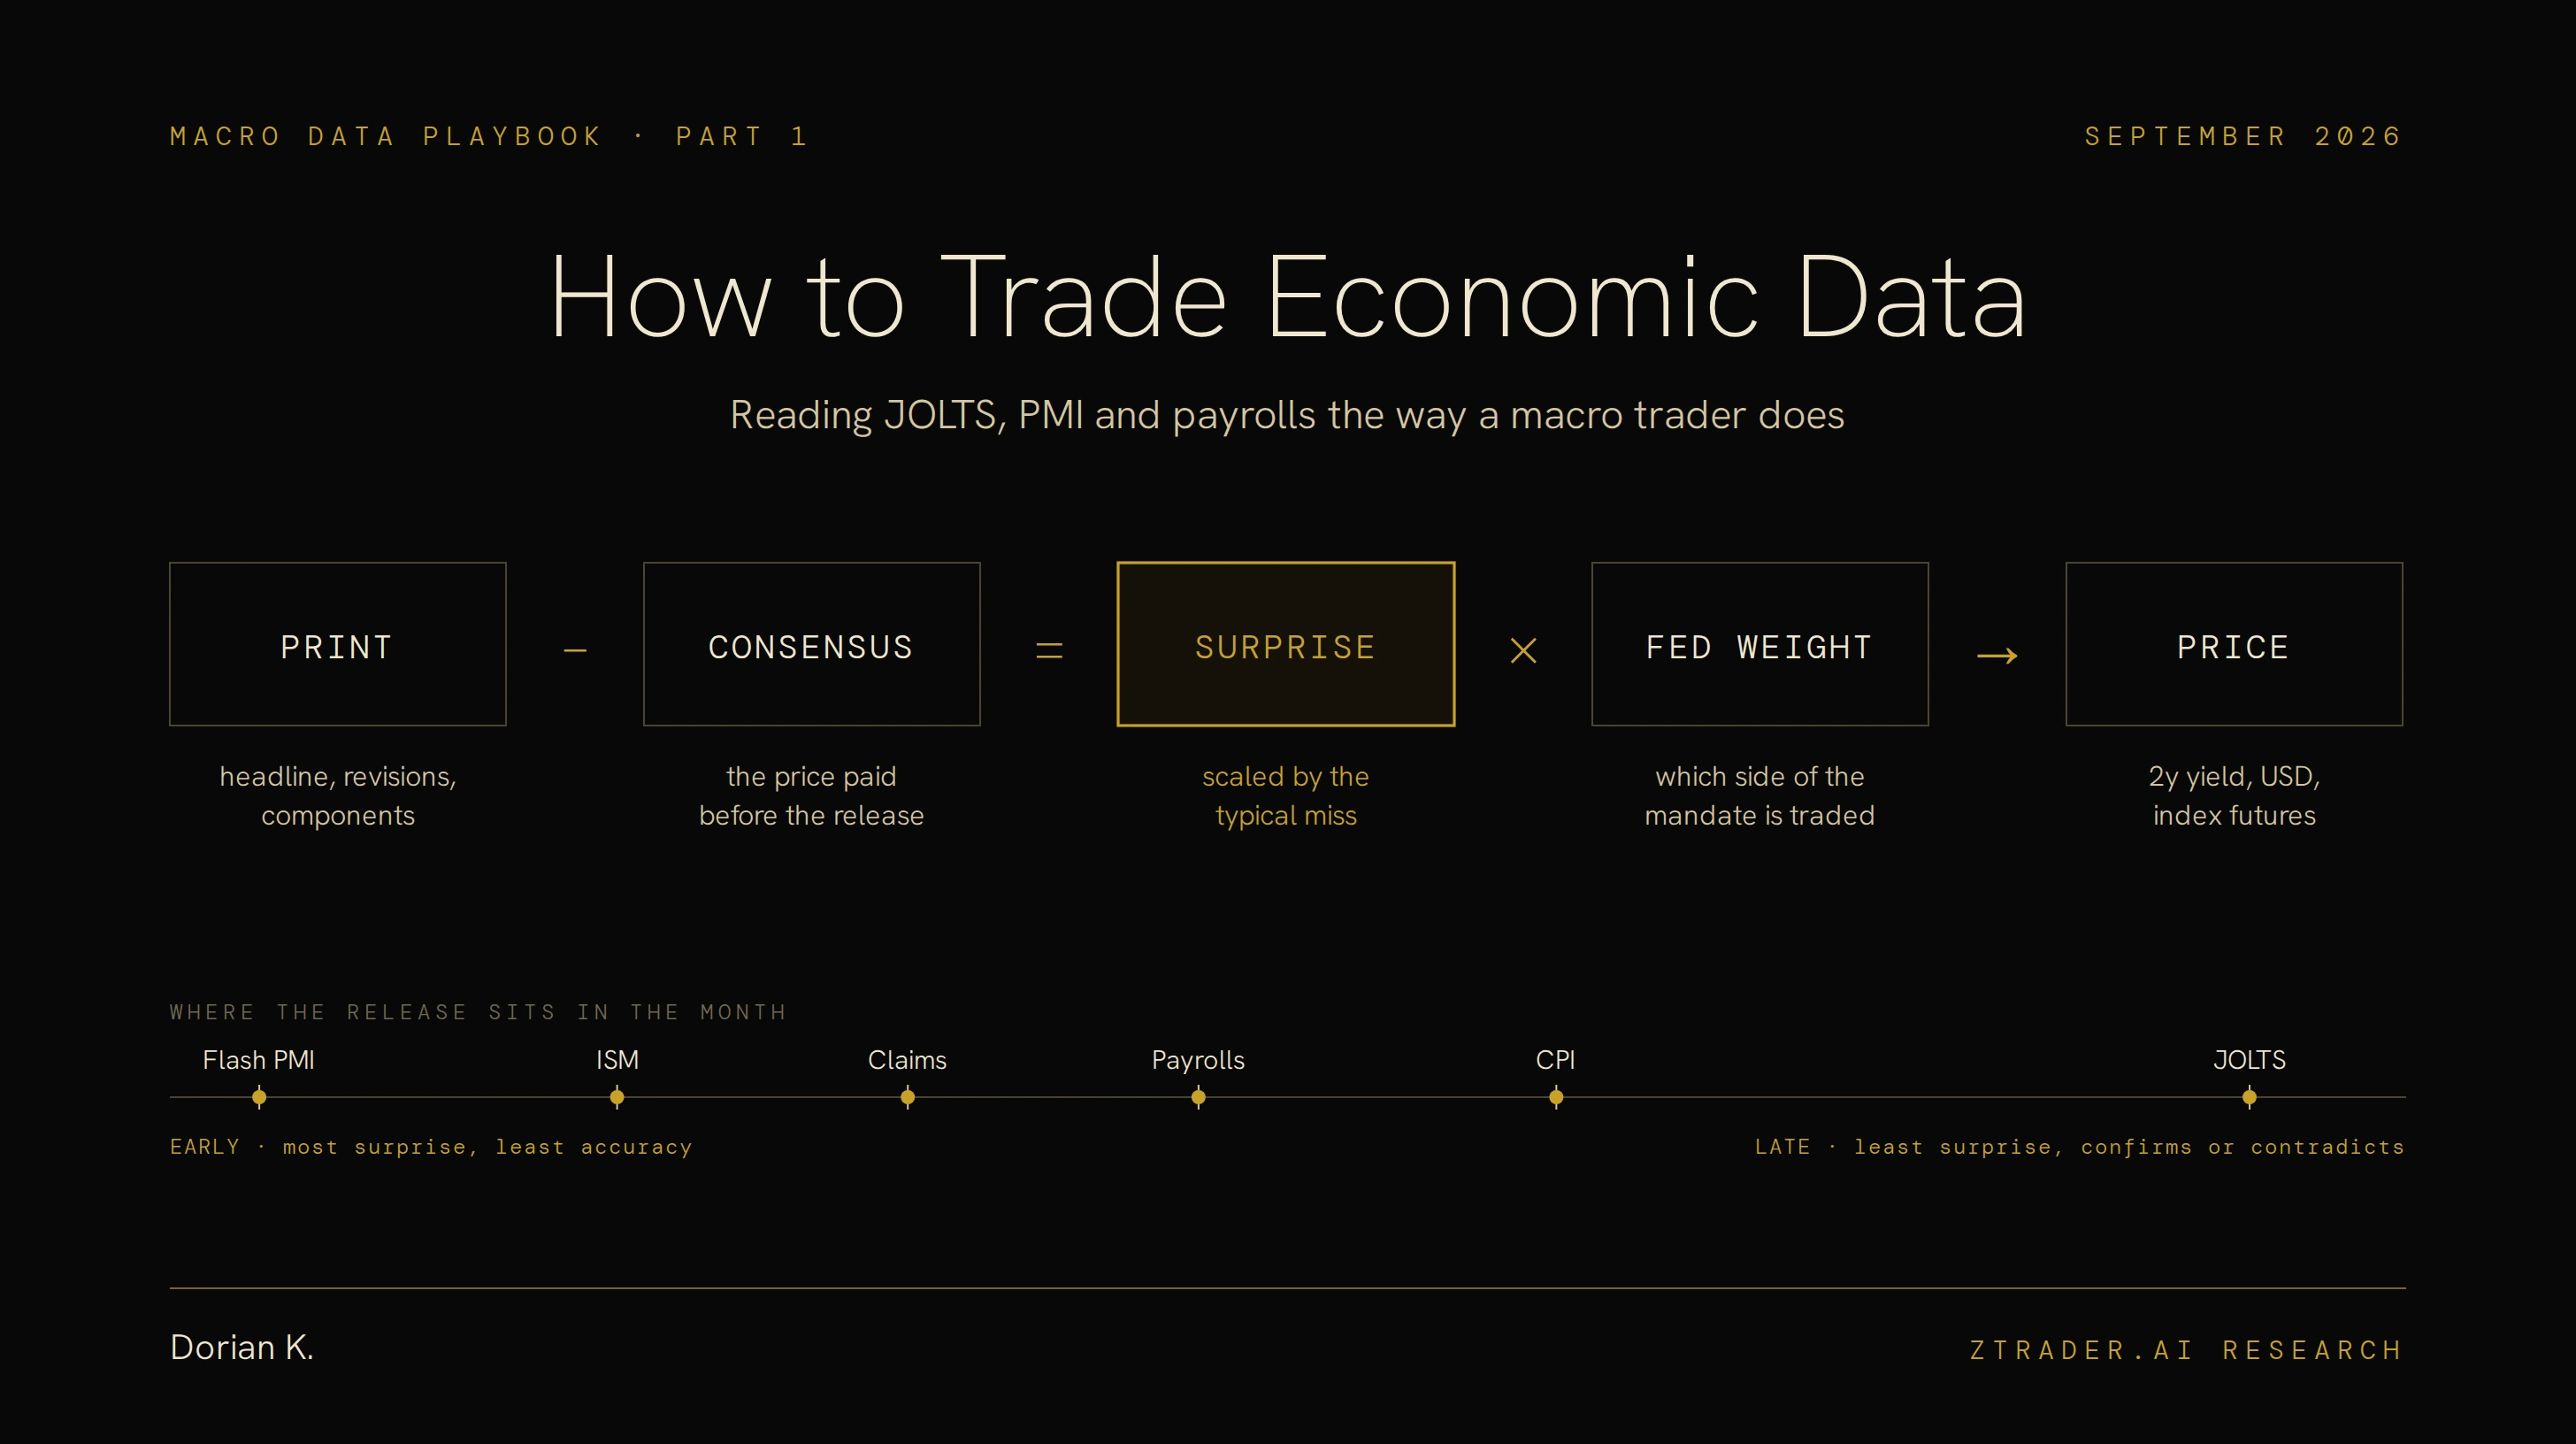
How to Trade Economic Data: Reading JOLTS, PMI and Payrolls Like a Macro Trader (Part 1)
Market reaction to economic releases is driven by surprise magnitude, calendar timing, and the specific Fed-focused component, rendering headline numbers virtually useless.
I. WHAT A RELEASE ACTUALLY DELIVERS
At 8:30 a.m. Eastern on Friday, September 4, the Bureau of Labor Statistics reported that the U.S. economy added 162,000 jobs in August.
The Dow Jones consensus was 53,000. Unemployment held at 4.1%, exactly as forecast. Traders raised their bets on a September rate hike that morning, and twelve days later the Fed delivered it: the first increase since 2023, taking the funds rate to 3.75–4.00%.
Payrolls had averaged 31,000 a month over the prior year, so 162,000 is an ordinary month by historical standards. The price action came from the 109,000 gap between the print and the forecast, landing on a Fed that had spent the summer telling anyone who would listen that inflation was its priority.
Every economic releases& indicators that reaches your screen can be seen as three things: the surprise against consensus, the revisions to earlier months, and the composition underneath the headline.
Market Consensus is key driver to Asset Price
Treat the survey median as one of the key price driver.
Forecasts get built into front-end rates, FX and index futures in the days leading up to the number, so a print that matches consensus is worth close to nothing.
What carries information is the real number minus market consensus.
scaled by how large that release’s forecast errors usually are. Payroll forecasts miss by tens of thousands in an ordinary month; a miss of the same relative size on core CPI is a far rarer event. Normalize every surprise by its own history before you compare one release with another.
Revisions are a second surprise inside the same timestamp
The August report also revised June from +20,000 to +31,000 and July from a 23,000 decline to a 21,000 gain, a combined +55,000.
Anyone reading only the headline missed that the summer hiring stall had been partly erased by the same release. Revisions hit the tape at the same second as the headline, and anyone judging the trend works from multi-month averages, so they carry just as much weight.
READ THE REVISIONS BEFORE YOU READ THE HEADLINE.
Composition decides how far the move runs
Average hourly earnings rose 0.3% on the month and 3.1% on the year. That moderate wage figure put a ceiling on how hard the payroll beat could be read as an inflation story, even while the job count itself argued against patience at the Fed.
II. HOW OLD EACH NUMBER IS WHEN IT LANDS
Macro data arrives in a fixed order, and that release order decides how much market surprise is left for each release.
For August 2026, the first survey came from S&P Global on August 21:
THE flash PMI published ten days before the month it describes had ended. ISM’s manufacturing report followed on September 1, the first business day.
Payrolls came on the 4th and CPI on the 11th. JOLTS for July was released on September 1 as well, 32 days after its reference month closed, and the August JOLTS is scheduled for September 29, thirteen days after the Fed had already moved.
Remember:
Economic data isn’t traded on absolute numbers—it’s traded entirely against the tape of what was expected and printed before.
By the time JOLTS appears, traders have seen weekly claims for the same period, two PMIs and usually a newer payroll report, so the openings count mostly confirms or questions a picture that is already in the price.
Early surveys have the opposite profile: the most surprise potential and the least accuracy. S&P Global’s flash manufacturing PMI for August printed 53.2 and was revised to 53.9 in the final release, a 0.7-point change on a survey whose monthly moves are often smaller than that.
The working rule follows from the calendar.
Trade early data in smaller size and for shorter holding periods. Use late data to confirm or kill a thesis you have already built, and be suspicious of any plan that starts a position on a release describing a month the market finished pricing weeks ago.
| Release | Publisher · timing | What it measures | Read first | Where it hits |
|---|---|---|---|---|
| S&P Global flash PMI | S&P Global · ~10 days before month-end · 9:45 ET | Share of firms reporting higher vs lower activity; manufacturing and services | Services vs manufacturing split; output and input prices | Earliest read on the month; front-end rates and FX |
| ISM Manufacturing PMI | ISM · 1st business day · 10:00 ET | Equal-weighted average of five diffusion indices | New orders minus inventories; supplier deliveries against prices paid | Cyclical equities, curve shape, industrial metals |
| Weekly jobless claims | Dept. of Labor · Thursdays · 8:30 ET | New and continuing unemployment-insurance filings | Continuing claims and the 4-week average | Turning points in layoffs; confirms or contradicts payrolls |
| Employment Situation | BLS · usually 1st Friday · 8:30 ET | Payroll survey of employers plus separate household survey | Two-month revisions, unemployment rate, hourly earnings | Front-end rates, USD, equity index futures |
| CPI | BLS · mid-month · 8:30 ET | Consumer prices, headline and core | Core month-on-month to two decimals; services components | 2-year yields, breakevens, the Fed path |
| JOLTS | BLS · ~5 weeks after month-end · 10:00 ET | Openings (stock on last business day); hires, quits, layoffs (monthly flows) | Quits rate, hires rate, revision to the prior month | Wage outlook; trades mainly when it contradicts payrolls |
III. JOLTS BELOW THE HEADLINE
JOLTS packs two different kinds of data into one release. Job openings are a stock: the positions open on the last business day of the month, as reported by a sample of employers.
Hires, quits and layoffs are flows:
Everything that happened to payrolls across the whole month.
The stock gets the headline, while the flows carry the information about wages and slack.
July 2026 shows how far apart the two can drift. BLS reported openings of 7.271 million, up 89,000 on the month.
That increase was measured against a June figure revised down by 177,000 to 7.182 million. Against the June number traders had seen a month earlier, 7.359 million, July was actually 88,000 lower.
Over the same month hires fell 278,000 to 5.054 million, pulling the hires rate from 3.4% to 3.2%, and quits dropped 157,000 to 3.056 million, a quits rate of 1.9%. Professional and business services alone accounted for 188,000 fewer hires.
The quits rate is the first line to read: Workers quit when they are confident of landing something better, and job-switchers have typically captured larger pay increases than people who stay put, so a falling quits rate shuts down one of the main channels through which aggregate wage growth rises.
The hires rate is the second line, because it measures how wide the door is for someone looking for work; at 3.2%, with layoffs steady at a 1.0% rate, July described a labor market where few people are fired and few are hired.
The Openings deserve the least weight of the four.
These numbers are revised heavily, as June’s 177,000 cut shows, and a posted vacancy says nothing about whether the employer intends to fill it this quarter.
Cross-check against real-time postings: Indeed’s index was hovering just under 2% above its pre-pandemic baseline in August, which points to more of the same in the next few JOLTS reports. The openings-to-unemployed ratio still has its uses.
With 7.27 million openings in July against 7.0 million unemployed in August, the ratio sits near one-to-one; in 2022, when it ran close to two, Fed officials cited it again and again as evidence of an overheated labor market.
JOLTS on its own rarely sets the front end, because it lands after a newer payroll report.
It’s tradable when it contradicts payrolls, and July into August 2026 was exactly that case: hiring flows weakening in one release while payrolls beat by 109,000 in the next.
IV. THE AUGUST’S PMI NUMBER 54.6
Fundamentally, PMI is essentially a diffusion metric: it measures the share of firms expanding plus half of those holding steady. A reading of 54.6 captures directional breadth rather than the size of the move.
This proxy holds up under normal cycles because breadth and magnitude move in tandem, but breaks down during structural supply shocks.
ISM’s headline Manufacturing PMI is an equal-weighted average of five sub-indices: new orders, production, employment, supplier deliveries and inventories. Supplier deliveries is inverted, so slower deliveries count as a positive, on the logic that suppliers slow down when demand is strong. That logic holds in an ordinary upswing and breaks when deliveries slow because of a war or a component shortage.
The August 2026 read was the textbook case.
The PMI printed 54.6, and the 4.6 points above 50 decompose as follows: supplier deliveries added 1.86, production 1.66, new orders 0.74, employment 0.24 and inventories 0.12.
The largest single contribution came from slower deliveries, in a month when ISM respondents cited the Iran war in 30% of negative comments and lengthening lead times in 46%. Strip supplier deliveries out and the remaining four components average 53.5.
SLOWER DELIVERIES ADDED MORE TO AUGUST’S PMI THAN NEW ORDERS DID.
The reading order that follows from this starts with new orders against inventories.
New orders fell 3 points to 53.7 and inventories stood at 50.6, leaving a spread of 3.1 points: still positive but narrowing.
Then set supplier deliveries read was against the prices paid.
When deliveries slow and prices climb while new orders fall, the PMI is reporting inflation pressure more than growth, and that combination adds to hawkish risk.
August had all three: deliveries up to 59.3, prices paid unchanged at 71.1, new orders down. Customers’ inventories at 42.8, deep in “too low” territory, is the one sub-index pointing to future production strength.
This index relies on two structural calibrations.
First, ISM places the GDP expansion breakeven at 47.5 (not 50), translating August’s 54.6 into ~2.4% annualized real growth—which proves that a manufacturing read dip below 50 isn’t an automatic recession signal.
Second, U.S. PMIs starts to diverge: S&P Global’s flash arrives ten days early and covers services (printing a cycle-high 56.0 composite in August). Rates desks use the flash for early momentum and ISM for the final word, scanning any cross-index divergence component by component before trading the print.
V. FED’S NEXT MOVE
The same surprise produces different price moves in different policy regimes.
In 2022, with inflation at multi-decade highs, CPI day was the main event and labor data mattered mostly as an input to wage inflation.
At Jackson Hole in August 2024, Powell said the Fed did not want further cooling in the labor market, and payrolls, claims and JOLTS took over as the releases that moved the front end.
2026 has swung the weight back to prices.
At Jackson Hole on August 28, Warsh put the focus squarely on inflation, noting that 54% of the 199 components of the PCE price index had risen more than 3% over the prior year, with headline PCE inflation at 3.7% over twelve months.
In that regime a payroll beat carries hawkish weight because it removes the labor market as an argument for patience, while softening JOLTS flows get far less attention.
Anyone who read July’s drop in hires as a dovish signal was reading 2026 data through a 2024 lens, and the September 16 hike settled the question.
The test for which release matters now is empirical.
For each major release, line up the change in the 2-year Treasury yield on the last six to eight release days against the size of the surprise.
The release with the largest move per unit of surprise is the one the current reaction function is trading. Re-run the exercise after every speech that shifts the Fed’s stated priorities, because the ranking changes with the chair’s emphasis and the old ranking keeps getting traded for weeks after it has stopped working.
VI. BEFORE THE NEXT PRINT
Before trading blindly, ask yourself the following questions before the next print:
What is the consensus, and how wide is the range of forecasts behind it?
The tighter the pre-release range, the sharper the market’s vulnerability; when consensus is nailed down, a miss delivers maximum informational impact.
Which component would change your view?
For payrolls it might be the two-month revision; for JOLTS, the quits rate; for ISM, new orders net of supplier deliveries.
What have earlier releases already revealed about the same month?
The later the release, the more of its content is already in the price.
Which side of the mandate is the Fed trading?
In September 2026, the answer is inflation, and every labor print gets filtered through that.
What size of surprise justifies a position, and what size justifies doing nothing?
Decide before the number, when there is no price moving on the screen to argue with you.
THE NEXT PRINT IS COMING:
August JOLTS on September 29, ISM’s September manufacturing report on October 1 and September payrolls on October 2.
NEXT Part We will use the same method to breakdown:
inflation complex, covering CPI, PCE and PPI and how the pieces feed into one another.