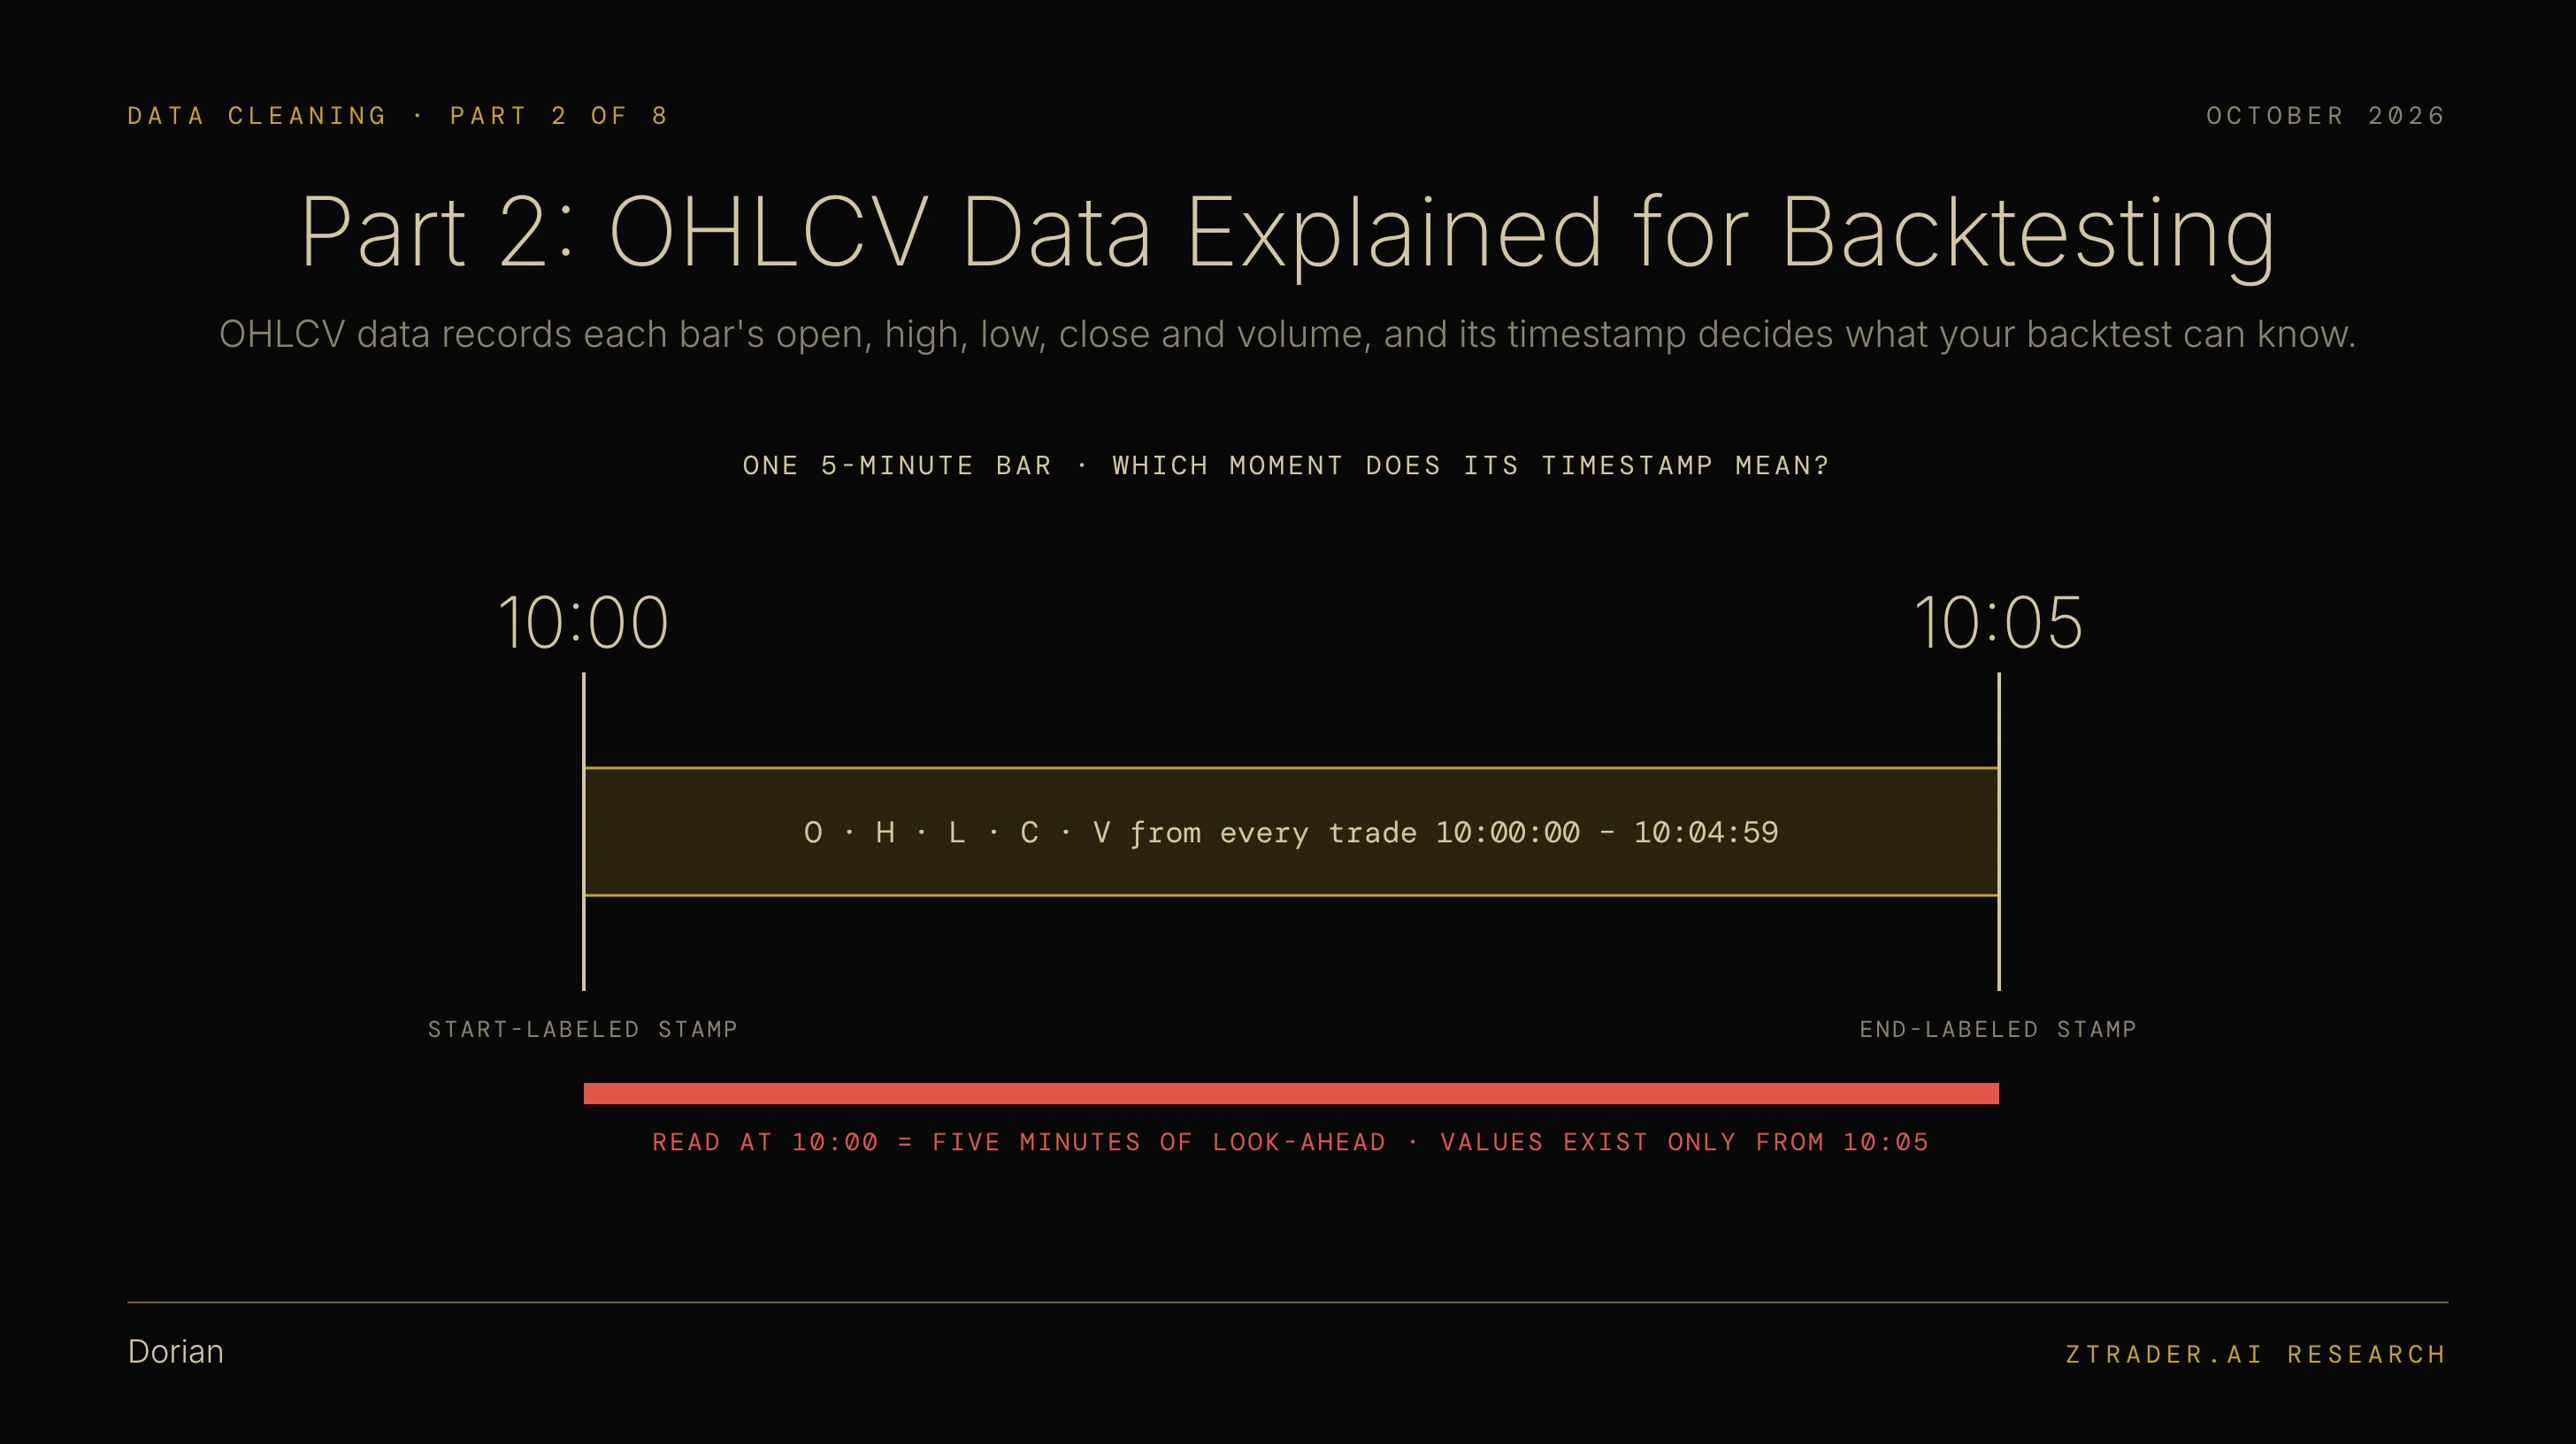
Part 2: OHLCV Data Explained for Backtesting
OHLCV data records each bar's open, high, low, close and volume, and its timestamp decides what your backtest can know.
Every chart you have ever traded from is built out of bars.
Every bar compresses thousands of trades into a handful of numbers stamped with a single time.
Most backtesting errors begin in what that compression hides.
Part 1 of this series showed that mistimed data is the hardest kind of dirty data to spot, because every value can be correct while the timing is wrong. OHLCV bars are where that problem starts for most traders, because the bar is the first dataset anyone downloads and the last one anyone questions. Whether you test a moving-average crossover on daily stock bars or an opening-range breakout on 5-minute futures bars, your results depend on three things the bar does not show on the chart: which moment its timestamp refers to, which hours count as one trading day, and which price counts as the close. This is Part 2 of an eight-part series on data cleaning and data processing for traders, and it explains how a price bar is built and how to read its timestamp before you trust a single backtest built on it.
I. What OHLCV Data Is
The five letters are familiar to every trader, but each field has a precise definition, and the precision matters once code starts reading the numbers instead of your eyes.
The Five Fields: What Each Number Records
OHLCV stands for open, high, low, close and volume, and each bar records those five values for one fixed period, such as one minute, one hour or one trading day:
- Open: The price of the first trade in the period.
- High: The highest traded price in the period.
- Low: The lowest traded price in the period.
- Close: The price that ends the period, which for daily stock bars is usually the official closing price set by the closing auction, as Section IV explains.
- Volume: The total number of shares or contracts traded during the period.
How a Bar Is Built: Trades In, Five Numbers Out
Every bar is built from individual trades. Databento, a market data vendor, describes its OHLCV bars as aggregated from trades, with volume equal to the total traded during the aggregation period. That construction has one consequence that catches many backtests off guard. If no trade happens during the interval, Databento prints no bar at all, so an illiquid stock or a quiet overnight futures session will show gaps in a 1-minute series. Your code has to treat a missing bar as "no trades happened" and must never fill it with an invented price. Part 7 covers how to handle those gaps.
Time Bars and the Alternatives
Most traders use time bars, which close every fixed number of minutes or days regardless of how much trading happened. Other bar types sample the market by activity instead of by the clock. Tick bars close after a fixed number of trades, volume bars close after a fixed number of shares or contracts, and dollar bars close after a fixed amount of traded value. Marcos López de Prado covers these alternatives in Chapter 2 of Advances in Financial Machine Learning. This series uses time bars throughout, because they are what nearly every charting platform and data vendor delivers by default.
Five numbers per bar look simple, but the bar's meaning depends on details the five numbers never show.
II. The Timestamp: Start or End of the Bar
Every bar covers a span of time, yet it is stored with a single timestamp, and the data file rarely tells you which end of the span that timestamp marks.
Two Conventions: Start-Labeled and End-Labeled Bars
Data sources split between two conventions:
- Start-labeled bars: The timestamp marks the moment the bar opens. Databento states that its timestamp marks the start of each interval, and TradingView's Pine Script documentation defines the time variable as the time of the bar's open.
- End-labeled bars: The timestamp marks the moment the bar closes, so a 5-minute bar stamped 10:05 covers trading from 10:00 to 10:05.
Python's pandas library shows how easily the conventions mix. Its resample function labels each bucket with its left edge, meaning the start, by default for most frequencies. For month-end, quarter-end, year-end and weekly frequencies, the default flips to the right edge, meaning the end. Two resampled series from the same raw data can therefore carry opposite labels without any warning.
How the Wrong Convention Creates Look-Ahead Bias
Consider a 5-minute bar stamped 10:00 under the start-labeled convention. That bar contains every trade from 10:00:00 to 10:04:59, and its close is the last price before 10:05. Now suppose your strategy treats that bar as information available at 10:00, for example by checking it against a signal generated at 10:00 or by entering a trade at 10:00 based on its close. Your backtest is using five minutes of prices that did not exist yet. The error is small on any single trade, but it repeats on every bar and inflates every result, which is exactly how look-ahead bias works.
Daily Bars Carry the Same Problem
Daily bars hide the issue behind a date. The bar stamped June 10 looks like information you had on June 10, but its close only exists after the 4:00 p.m. ET closing auction finishes. Any rule that uses the daily close to trade during that same session is trading on a number it could not yet see. The safe rule is simple: a bar's values become usable only after the bar's end time, whatever its label says.
Know which end of the bar the timestamp marks before you join it to anything else.
III. What Counts as One Trading Day
Daily bars raise a second question that intraday bars do not, because the start and end of one trading day depend on the market, the vendor and the time zone.
US Stocks: Regular Hours and Extended Hours
The US stock market's regular session runs from 9:30 a.m. to 4:00 p.m. ET, Monday through Friday. Nasdaq also runs pre-market trading from 4:00 a.m. to 9:30 a.m. ET and after-hours trading from 4:00 p.m. to 8:00 p.m. ET, according to Fidelity. Traders call the first window regular trading hours, or RTH, and the full window extended trading hours, or ETH. Whether a vendor's daily bar includes the extended sessions changes the high, the low and the volume, so check your vendor's definition before you compare a backtest with live fills.
Futures: The Trading Day Starts the Evening Before
E-mini S&P 500 futures trade from 6:00 p.m. to 5:00 p.m. ET, Sunday through Friday, with a one-hour maintenance break between sessions, according to StoneX and LuxAlgo. In Central Time, the exchange's home time zone, that is 5:00 p.m. to 4:00 p.m. That means the futures bar dated Monday begins on Sunday evening, and every weekday bar begins the evening before its date. Databento notes that its daily bars are based entirely on prices and volumes from the electronic trading session. Either way, a daily futures bar and a daily stock bar with the same date cover different hours.
Time Zones: Store Everything in UTC
US exchange times move with daylight saving time. Eastern Time runs at UTC−4 in summer and UTC−5 in winter, while Tokyo stays at UTC+9 all year. The 9:30 a.m. ET open therefore lands at 22:30 in Tokyo during US summer time and 23:30 during US winter time. Any dataset that mixes local timestamps across markets will misalign by one hour for part of every year. The standard fix is to store every timestamp in UTC and convert to local time only for display.
One "daily" bar can cover six and a half hours, sixteen hours or twenty-three hours, depending on where it came from.
IV. Which Price Is the Close
The close is the most-used number in technical analysis, and it is also the field most likely to differ between two data sources for the same day.
US Stocks: The Official Close Comes From the Closing Auction
US exchanges set the official closing price through a closing auction. Nasdaq's Closing Cross starts at 4:00 p.m. ET, when Nasdaq calculates the single price that matches the largest number of shares and executes the whole cross at that price, called the Nasdaq Official Closing Price. That price can differ from the last trade printed in the final seconds of continuous trading.
The auction is also where a large share of the day's volume trades:
- Typical day in 2024: The US closing auction matched about $50 billion in notional value, roughly 9% of total daily trading volume, according to BMLL.
- Index rebalances and option expirations: The closing auction accounted for about 20% of daily volume on those days.
- Russell reconstitution, June 28, 2024: Over 34% of total daily notional volume was executed in the closing auction.
For a backtest, this has two consequences. Any strategy that assumes it can buy or sell at the close needs the official closing price, because that is the price a market-on-close order actually receives. Volume filters and volume-based signals on intraday bars will also see a large spike in the final bar, because the auction volume lands there.
Futures: Settlement Price and Last Trade Are Two Different Numbers
Futures add a second definition of the close. The exchange publishes a daily settlement price, which is used for daily mark-to-market and is generally different from the last traded price. NexusFi explains that E-mini S&P 500 settlement is a 30-second volume-weighted average price calculated between 2:59:30 and 3:00 p.m. Central Time, even though trading continues until 4:00 p.m. CT. NexusFi also notes that cheaper data aggregators that build daily bars from intraday trades may use the last traded price, while most professional providers use settlement as the daily close. Databento adds that official settlement figures can include block trades and OTC transactions, so daily bars built only from electronic trades can differ from exchange settlement data.
Before you compare two daily closes, confirm that both sources define the close the same way.
V. Five Checks for Any OHLCV File
Each section above translates into a check you can run before a single backtest result goes into your notes:
- Does each timestamp mark the start or the end of the bar, and does every series you join use the same convention?
- Does your strategy use any bar's values before that bar's end time?
- Does each daily bar cover regular hours only, or extended hours as well, and does that match how you plan to trade?
- Are all timestamps stored in UTC, so daylight saving changes cannot shift your bars by an hour?
- Is the daily close the official closing price, the futures settlement price, or the last traded price?
| Field | What it means | What to check |
|---|---|---|
| Timestamp | One moment that stands for the whole bar | Start or end of the bar? Stored in UTC? |
| Open | Price of the first trade in the period | Does the session include pre-market trades? |
| High / Low | Highest and lowest traded prices | Do extended hours set the extremes? Any bad prints? |
| Close | Price that ends the period | Official auction close, futures settlement, or last trade? |
| Volume | Total shares or contracts traded | Does it include the closing auction and extended hours? |
| Session | Hours counted as one trading day | RTH or ETH? Futures day starts the evening before. |
OHLCV data looks like the simplest dataset in trading, yet every bar depends on three definitions it never displays. The timestamp tells you which moment the bar refers to, and a start-labeled bar used as if it were complete hands your backtest minutes or hours of future prices. The session definition tells you which hours count as one day, and a US stock bar, an extended-hours bar and a futures bar with the same date cover different stretches of time. The close definition tells you which price ended the day, and the official auction close, the futures settlement price and the last trade can all differ. Confirm those three definitions for every data source, use each bar only after its end time, and store every timestamp in UTC. That is how a price bar becomes a reliable input for every backtest built on top of it. Part 3 takes look-ahead bias and survivorship bias apart with real examples.