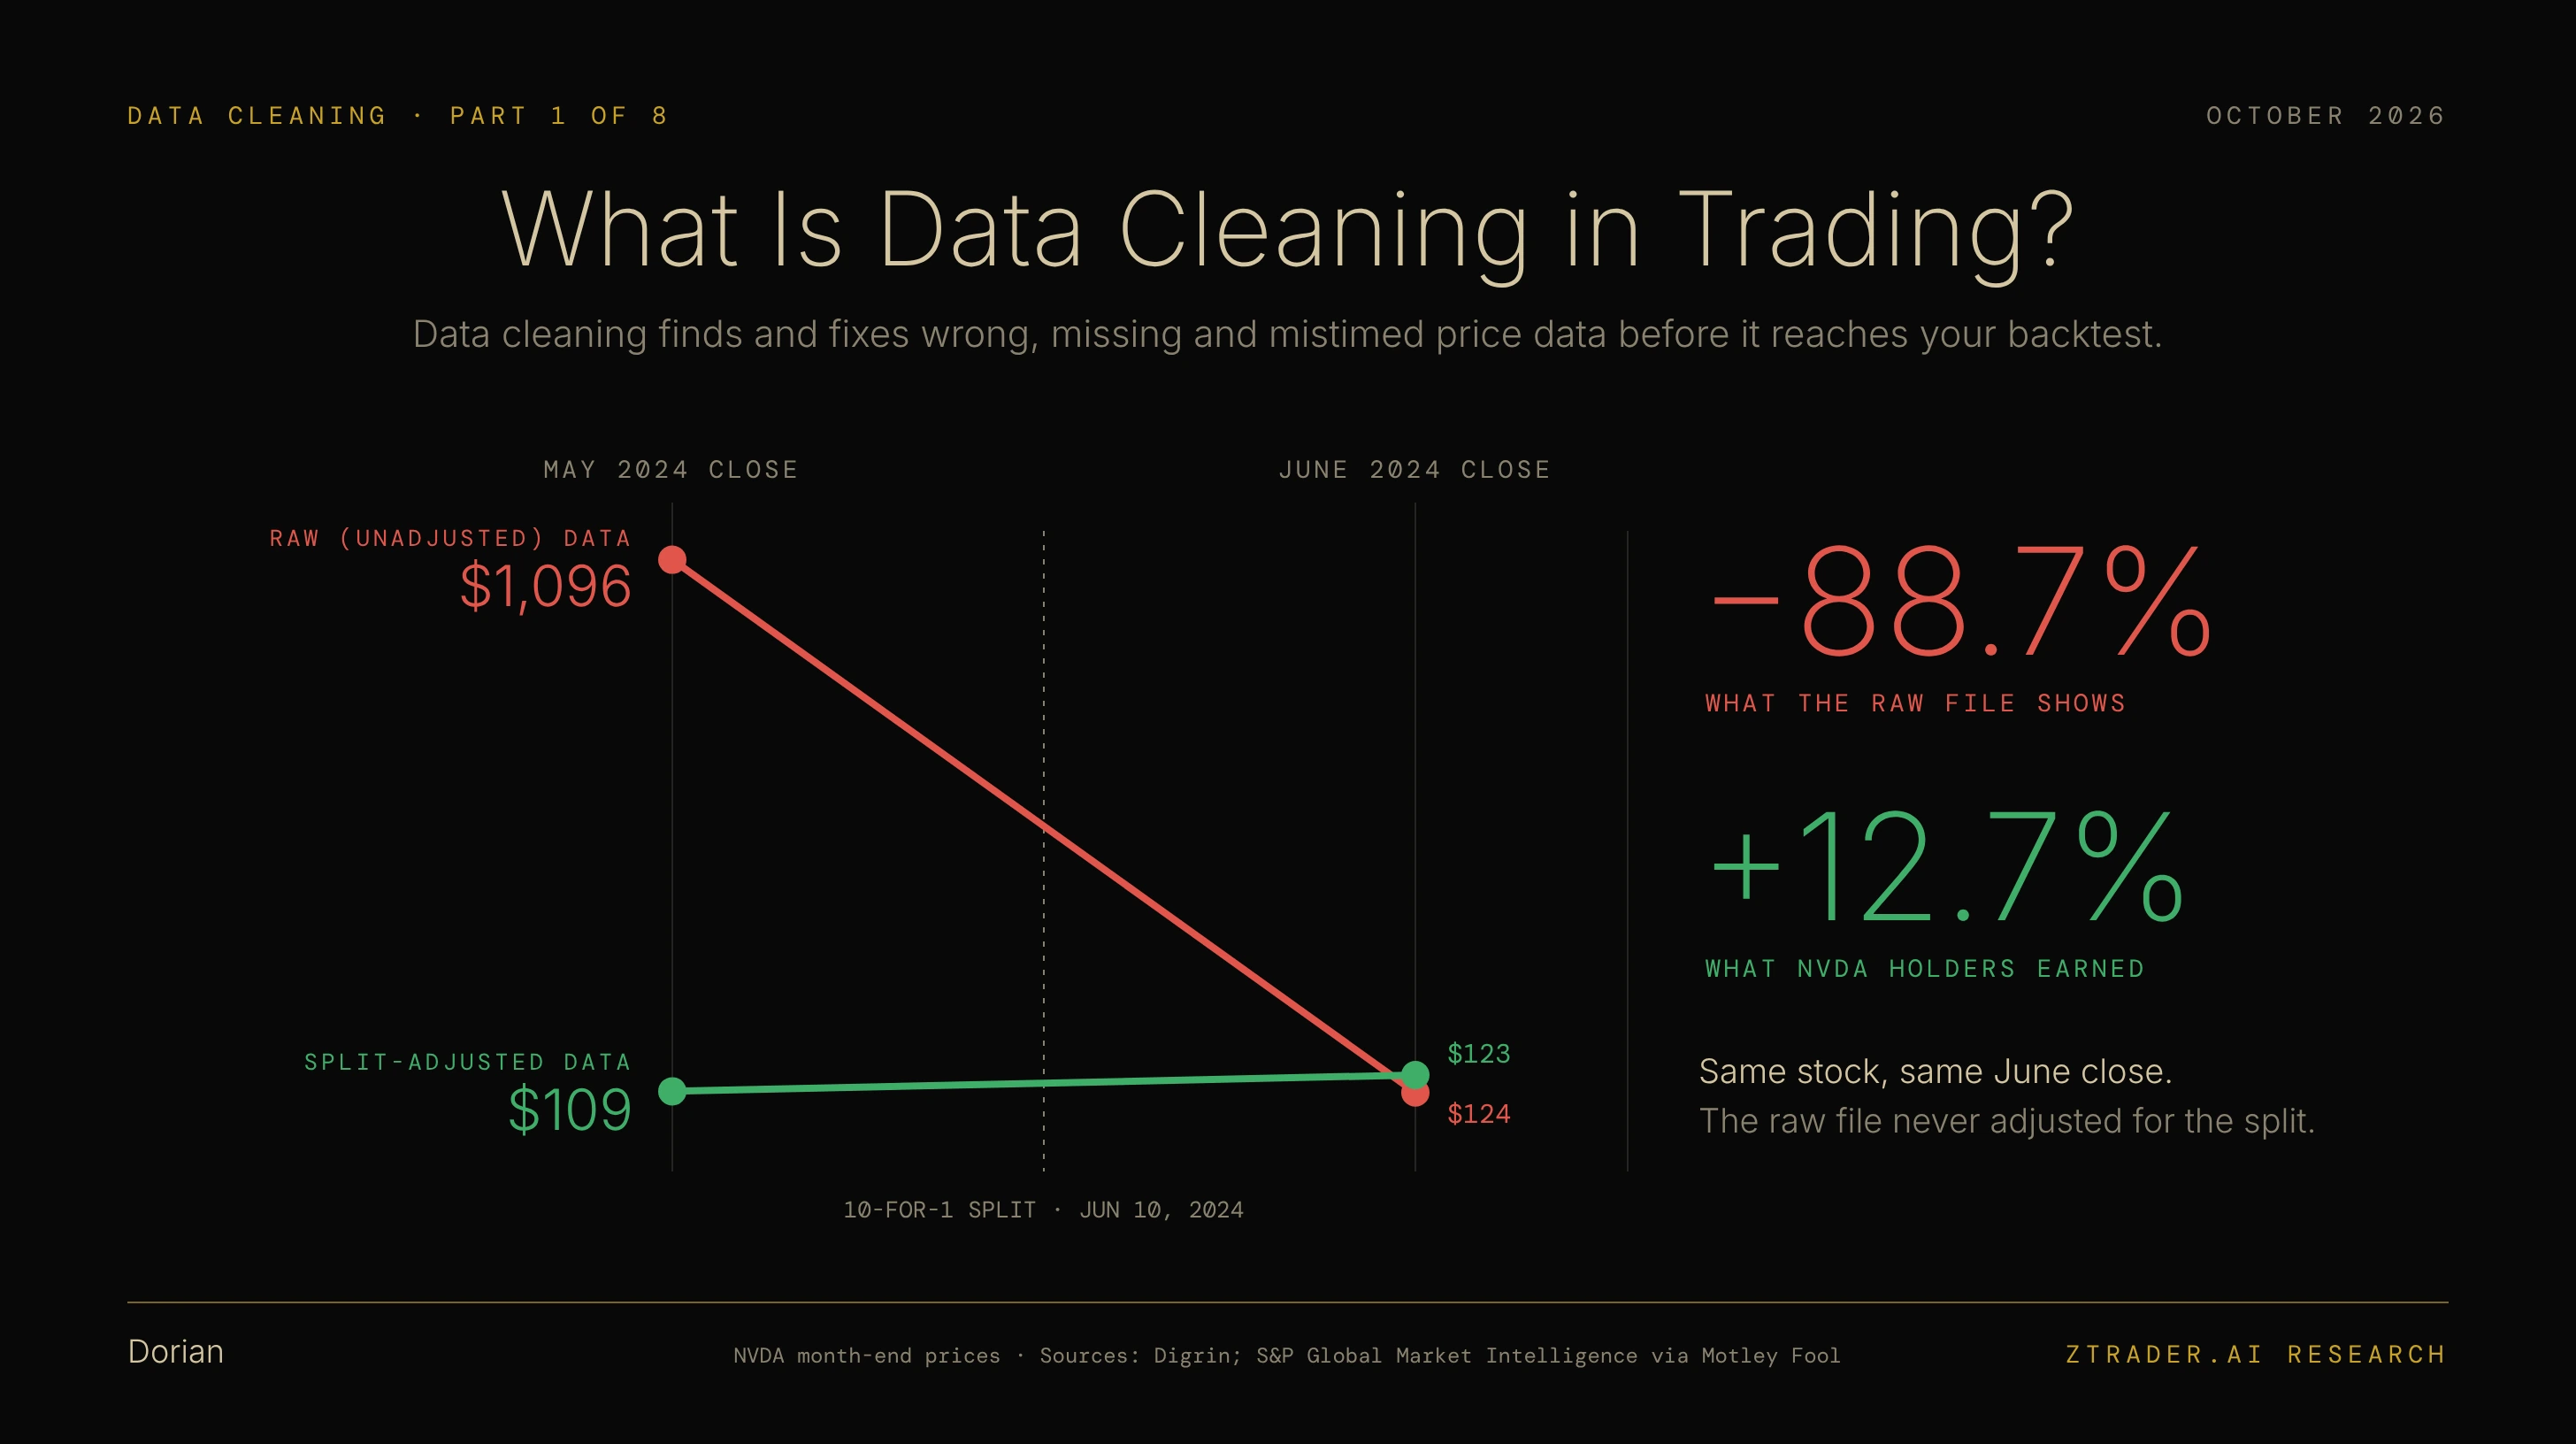
What Is Data Cleaning in Trading?
Data cleaning finds and fixes wrong, missing and mistimed price data before it reaches your backtest.
Every backtest is a story about the past—and that story is only as true as the numbers beneath it.
Bad data rarely looks bad on a price chart. That stealth is precisely why it survives to infect so many production strategies.
Before testing any trading thesis, the standard workflow feels simple: load years of historical prices into a spreadsheet or backtesting engine, assuming those prints mirror what actually executed in the market.
That assumption fails far more often than most traders realize. Historical datasets are routinely contaminated with bad prints, exchange gaps, and look-ahead timing errors that a strategy cannot detect on its own.
Data cleaning is the critical firewall that intercepts these anomalies before they corrupt your performance metrics. Whether you trade US equities, futures contracts, or event-driven macro releases, it is a non-negotiable step.
This is Part 1 of an eight-part series on data cleaning and data processing for traders.
Here is your roadmap:
- What data cleaning actually means in a trading context
- The three distinct categories of dirty data you will encounter
- The strongest argument against cleaning data altogether
- The golden rule that resolves that debate once and for all
I. What Data Cleaning Means for a Trader
While borrowed from general data science, “data cleaning” carries a far tighter, more practical definition in quantitative trading.
The Plain-English Definition
At its core, a backtest is simply a simulation running your trading logic across historical data to evaluate past performance. Every metric it outputs—from win rate and Sharpe ratio to maximum drawdown—is derived entirely from the inputs provided. When raw data carries a flaw, the engine silently compounds that error into every result. Nothing in the output will raise a red flag.
Cleaning vs. Preprocessing: Two Separate Workflows
Traders frequently conflate data cleaning with data preprocessing, but they represent two fundamental and distinct stages in the pipeline:
- Cleaning guarantees correctness. It rights bad prices, flags or fills data gaps, and synchronizes every data point with the exact timestamp it actually became available to the market.
- Preprocessing guarantees usability. Occurring strictly after cleaning, it transforms verified data into structured features your strategy or model can consume—such as log returns, technical indicators, and scaled inputs.
The early installments of this series focus on cleaning; the remaining chapters transition into processing.
Bottom line Cleaning determines whether your data is true; preprocessing determines whether it is usable.
II. Where Dirty Data Comes From
Dirty data in trading takes three distinct forms, and each one corrupts your backtest in its own destructive way:
- Wrong Values: Prices or volumes that never actually existed in real-world trading.
- Missing Values: Omitted bars, missing ticks, or entire tickers that ought to be in your dataset but aren’t.
- Mistimed Data: Information timestamped before it was actually made public, introducing fatal look-ahead bias.
Wrong Values: These Are Prices That Never Traded
To understand bad values, start with the absolute foundation: what is a tick really and how does it work?
The tick is a single recorded trade or quote—the smallest atomic unit of market data. The so-called “bad tick” occurs when data is logged without ever representing executable reality. Common culprits include zero or negative price prints, duplicate records, or structural impossibilities (like a daily bar whose High rests below its Close).
It takes only a single corrupted print to poison an entire backtest.
Consider a real-world case from the QuantConnect community: a trader observed a simulation where buying back 35 short call contracts inexplicably appeared to cost $3 million.
The root cause?
Corrupted historical data generated a phantom spike that forced an automatic, artificial margin call—an artifact that never existed in live market feeds.
Corporate actions generate a far subtler and more pervasive form of wrong value.
When Nvidia executed its 10-for-1 stock split after the close on Friday, June 7, 2024, its shares opened the following Monday, June 10, at roughly one-tenth of their previous price.
Real-world shareholders lost zero purchasing power because their share count multiplied by ten.
However, fed into an unadjusted price series, that Monday open presents itself as a catastrophic 90% market crash.
Any quantitative logic processing that raw series will react to a non-existent market meltdown.
Futures traders face the same problem in a different form.
So what is a back-adjusted continuous contract?
It is a long price history built by stitching expiring futures contracts together and shifting older prices so the gaps between contracts disappear. The shift has a cost: according to NexusFi, back-adjusted crude oil can show the 2008 peak above $185 a barrel, when the actual high was $147, because the adjustment accumulates every roll cost along the way.
Part 5 explains which adjustment method fits which kind of strategy.
Missing Values: The Non-Existing Bars and Stocks
Missing bars are the more visible half of this problem:
Trading halts, market holidays and gaps in a data feed all leave holes in a price series, and your code needs to know the difference between a market that was closed and a feed that simply failed to record. Filling the gap the wrong way can invent prices that never existed.
Missing stocks are the half that does far more damage. Many free databases only carry companies that still trade today, which means every company that went bankrupt, was acquired or was delisted has quietly disappeared from the history. What is survivorship bias?
It is the distortion that appears when you test only on the survivors, and it inflates returns because the losers have already been removed from the sample before your test begins. Part 3 covers survivorship bias in detail.
Mistimed Data: Information You Couldn’t Have Known Yet
Mistimed data is the most insidious error in quantitative research because every individual data point can be factually correct, yet its timing is entirely wrong.
Daily OHLC bar data is the classic example. Bar data is typically timestamped with a date, but its closing price isn’t actually finalized until after the 4:00 p.m. ET market close.
Any backtest that triggers a trade at the close using that same closing price is executing on information it could not possibly have known before the trade occurred.
Economic indicators add a second, even more dangerous layer: historical revisions. Official figures are frequently restructured long after their initial release:
- In September 2025, the U.S. Bureau of Labor Statistics (BLS) released a preliminary benchmark revision shaving 911,000 jobs (−0.6%) off nonfarm payroll employment for the year ending March 2025—far exceeding the average decade revision of 0.2% and marking the largest downward adjustment since at least 2000.
- By the time the final benchmark was locked in February 2026, total 2025 payroll growth was slashed to just 181,000 from the originally reported 584,000.
If you backtest an event-driven payroll strategy using today’s revised dataset, your model is making decisions based on refined numbers that no trader on Earth had access to on release day.
Understanding Look-Ahead Bias
Mistimed data is the single largest contributor to look-ahead bias in quantitative finance.
| Type | What it looks like | Example in this article | Effect on the backtest |
|---|---|---|---|
| Wrong values | Bad ticks, unadjusted splits, back-adjusted futures prices | Raw NVDA data shows −88.7% in June 2024; back-adjusted crude oil can show the 2008 peak above $185 when the actual high was $147 | Fake crashes and signals, false margin calls |
| Missing values | Feed gaps, halts, delisted stocks removed from the database | Free databases that only carry companies still trading today | Inflated returns from survivorship bias; invented fill prices |
| Mistimed data | Closing price used before the close; revised data used before it was published | 2025 payroll growth revised from 584K to 181K | Look-ahead bias: trades on information not yet available |
The Unspoken Pattern
Each form of dirty data—whether a phantom price spike, an unadjusted corporate split, or a revised macroeconomic release—drags a backtest in the exact same direction: toward inflated returns and unrealistic performance metrics that cannot survive live execution.
III. The Strongest Argument Against Cleaning
Not every data engineering professional agrees that historical market data should be actively cleaned. Their counter-perspective is rooted in real-world infrastructure challenges and deserves a rigorous hearing before you start dropping rows from your dataset.
Databento’s Position: When Cleaning Degrades Quality
Market data vendor Databento argues that conventional data cleaning often makes historical datasets worse. Their thesis hinges on how data sanitization is executed in practice:
- The Production Mismatch: Most cleaning pipelines run as an offline, second-pass script over stored historical files. This creates a fundamental divergence between the pristine history your model is evaluated on and the raw, unedited tick stream your live algorithms must parse in real time.
- Modern Exchange Standards: Electronic venue matching engines over the past two decades have eliminated the vast majority of historical tick anomalies.
- Algorithmic Resilience: Robustness should be engineered directly into the execution logic itself rather than relying on scrubbed, idealized inputs.
Consider what this mismatch looks like in a live environment:
Suppose you filter out every intraday price spike that immediately mean-reverts. Your backtest never touches those erratic prints.
In production, however, your trading engine processes each spike the microsecond it occurs—with zero foresight that a reversal is coming—and executes orders based on those prices.
Your backtest and your live algorithm are now operating in two completely different realities.
Where the Counter-Argument Reaches Its Limit
Databento’s critique primarily targets retrospective tick filtering (e.g., arbitrarily smoothing outliers after the fact).
It is not an argument against correcting structural market mechanics:
- It does not oppose adjusting for stock splits or cash distributions.
- It does not endorse survivorship bias by omitting delisted assets.
- It does not suggest backtesting event-driven models on post-hoc economic revisions.
Failure to address these structural realities guarantees the spurious backtest results highlighted in Section II.
Indeed, Databento explicitly notes that data intervention remains essential for OTC markets, open-outcry platforms, lossy distributor feeds, and low-resolution aggregated bars with opaque sampling methodologies.
The Golden Rule That Settles the Debate
Both arguments converge on a single, uncompromising principle:
Every cleaning operation applied to historical data must be an operation your live production engine could execute at that exact microsecond, strictly using information available at that moment.
- PASSSplit Adjustments: Corporate actions are publicly announced prior to ex-date execution.
- PASSPoint-in-Time Macro Data: Utilizing initial-release payroll figures reflects the exact data visible on release day.
- FAILRetrospective Spike Filtering: Deleting a price print because it reversed 30 seconds later relies on future information no live system could possess.
Ultimately Clean data is data that perfectly mirrors what you would have observed—and could have actually traded—at the precise moment it occurred.
IV. Five Questions to Ask Before Your Next Backtest
The three types of dirty data and the rule above translate into five checks you can run on any dataset before trusting the results:
- Has every split and dividend been adjusted, and do you know whether your platform is showing you adjusted or raw prices?
- Does your stock universe include companies that were later delisted, or only the ones still trading today?
- For every bar and every data point, at what exact time would that value have been available to you?
- Are you using economic data as it was first released, or the latest revised version?
- Could your live system apply every cleaning rule you used in the backtest, in real time, with no knowledge of what happened next?
If any answer is unclear, the backtest result is unclear too.
V. What This Series Covers Next
This article gave you the map, and the next seven parts take each area in turn:
- PART 2 Explains OHLCV data, how a price bar is built and how its timestamp is defined.
- PART 3 Covers look-ahead bias and survivorship bias with real examples.
- PART 4 Compares adjusted and unadjusted stock prices and when to use each.
- PART 5 Explains continuous futures contracts and the difference between back-adjusted and ratio-adjusted series.
- PART 6 Covers point-in-time data and release times for macro and earnings data.
- PART 7 Deals with outliers, missing data and bad ticks.
- PART 8 Moves into feature normalization, labeling and splitting data for testing.
The Bottom Line: Backtest the Market You Could Have Traded
Data cleaning is fundamentally the discipline of ensuring your historical dataset reflects the exact market you could have actually traded.
Ultimately, that work comes down to systematically neutralizing three core threats:
- Wrong Values: Eliminating bad ticks, accounting for corporate splits, and properly adjusting continuous futures contracts.
- Missing Values: Identifying data gaps and preserving delisted equities to eliminate survivorship bias.
- Mistimed Data: Eliminating look-ahead bias by preventing the use of closing prices prior to the close and macro figures prior to their actual publication.
Every single one of these errors pushes a backtest in the same dangerous direction: it makes the strategy look vastly better on paper than it could ever perform in reality.
The ultimate test for any data cleaning fix is simple and uncompromising: Could your live production system have applied this exact same fix at that exact same microsecond?
Hold your historical data to that standard, and your backtest becomes a true, reliable preview of what live execution will deliver.