US Inflation · October CPI
Why October CPI Has No Annual Rate and Still Moved the Fed
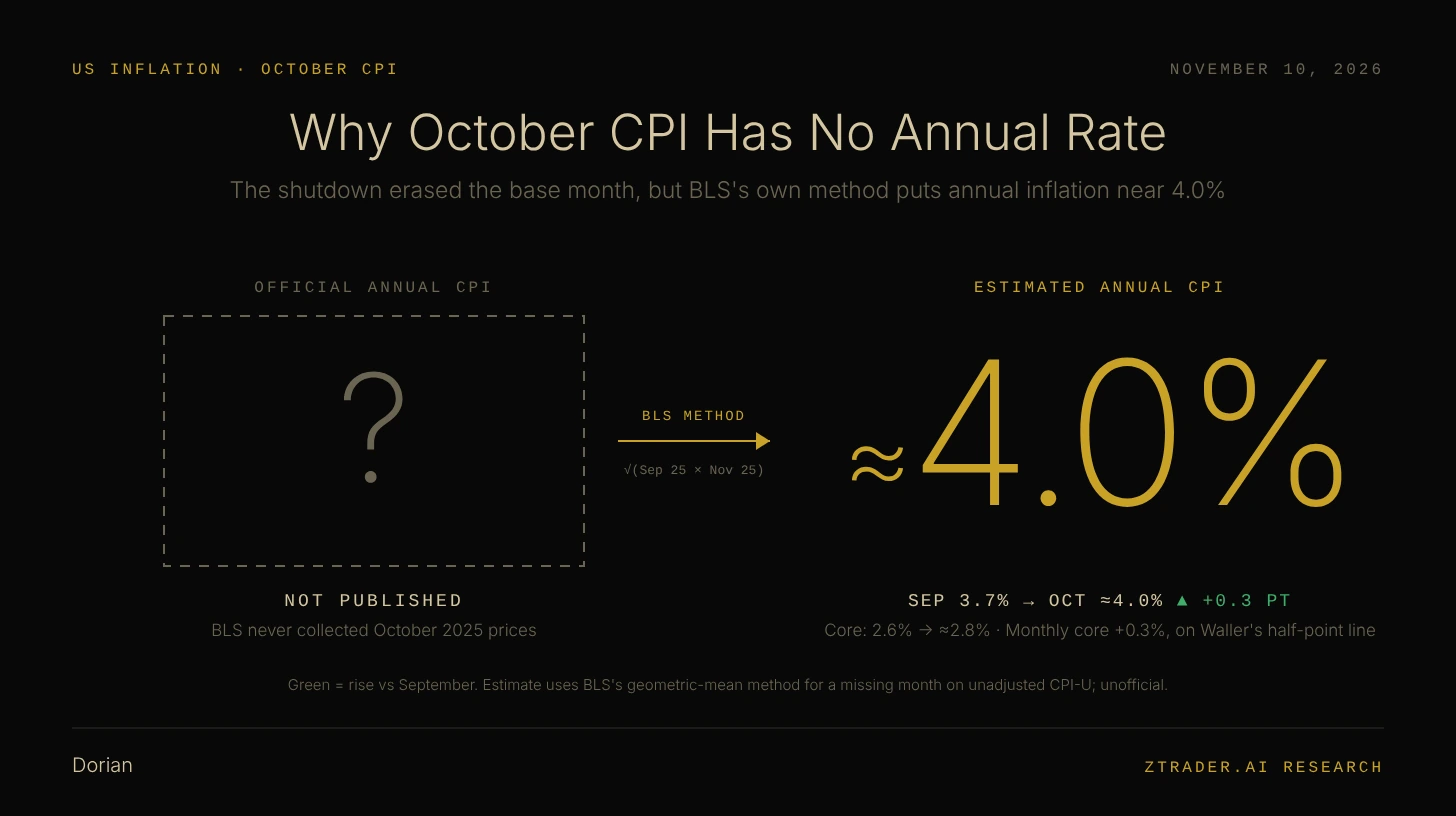
The shutdown erased the base month, but BLS's own method puts annual inflation near 4.0%.
The October CPI report arrived without its most quoted number.
The numbers that did arrive helped push the 2-year Treasury yield up by nearly two-tenths of a percentage point by mid-morning.
Traders who waited for an annual rate to confirm the trend found that the bond market had already priced it.
On Tuesday, November 10, the Bureau of Labor Statistics published the October consumer price index without year-over-year inflation rates for headline and core CPI, because its staff never collected October 2025 prices during last year's government shutdown. That gap matters for anyone trading rates, the dollar or US equities into the Fed's December 8–9 meeting, because the monthly figures now carry the whole message, and the monthly figures came in hot. Headline CPI rose 0.4% against a 0.3% consensus. Core CPI, which excludes food and energy, rose 0.3% against a 0.2% consensus, and that core reading landed on the threshold that Fed Governor Christopher Waller had set for a half-point hike only hours earlier. Reading this report correctly therefore means rebuilding the missing annual rate, separating the components that actually moved, and lining the data calendar up against the Fed's own calendar.
I.WHERE THE ANNUAL INFLATION RATE WENT
The missing annual rate traces back to a single month of prices that BLS never collected in the autumn of 2025.
The Shutdown Gap: What BLS Never Collected
Year-over-year inflation compares a price index with its level twelve months earlier, so the October 2026 annual rate needs an October 2025 index level to divide by. BLS did not collect its survey price data in October 2025 because of the lapse in federal appropriations, and the bureau has said that it cannot collect those prices retroactively. Without that base month, BLS cannot publish 12-month changes for most October 2026 indexes, and headline and core CPI are both on that list.
The gap is also wider than most previews suggested. BLS marks the October 2025 index values as unavailable, and the November 2025 monthly changes are missing as well, because a monthly change for November needs an October level to start from.
Chart 1 plots the seasonally adjusted monthly change in headline and core CPI from September 2025 to October 2026. Seasonally adjusted figures remove the price moves that recur at the same time every year, such as holiday discounting, so that one month can be compared fairly with the next. The shaded band marks the two months with no published monthly change, and the dotted circles on the right show where economists expected October to land.
The Exception: Why Gasoline Still Has an Annual Rate
Some series kept their base month. BLS was able to recover most of its nonsurvey data for October 2025 after the fact, and the gasoline index is among the series that still carry a published 12-month change, at +37.4% before seasonal adjustment. The broad CPI, by contrast, lost its year-ago anchor.
The October report lost its base month, and BLS publishes a method for estimating exactly that kind of gap.
II.HOW TO REBUILD THE NUMBER BLS COULD NOT PUBLISH
BLS's own guidance on missing months gives traders a way to recover a usable annual rate without guessing.
The BLS Method: Geometric Mean of the Neighboring Months
BLS's fact sheet on approximating missing data recommends taking the geometric mean of the index values in the months immediately before and after the gap. In practice, that means multiplying the September 2025 and November 2025 index levels together and taking the square root of the product. The CPI for all urban consumers, known as CPI-U, is the index behind the headline number. Applied to the unadjusted CPI-U, the method puts the October 2025 index at about 324.46, and the published October 2026 index of 337.51 then implies headline inflation of about 4.0% over twelve months, up from 3.7% in September. The same calculation on core CPI implies annual core inflation of about 2.8%, up from 2.6% in September.
The Cross-Check: Where Forecasters Landed
UniCredit's pre-release estimate also had annual headline inflation rising to 4.0% and annual core inflation rising to 2.8%, so the BLS-method result matches how at least one major desk was modeling the base effect. BLS states that figures calculated this way are unofficial estimates, which makes them a tool for a trader's model rather than a figure to quote as official data.
By BLS's own arithmetic, annual headline inflation climbed from 3.7% in September to roughly 4.0% in October.
III.WHAT DROVE THE 0.4% HEADLINE
Food and housing contributed more to the October headline than energy did, which makes October different from the energy-driven months that came before it.
Food and Shelter: Bigger Contributors Than Energy
The food index rose 0.5% in October after holding flat in September. Food at home rose 0.4%, with beef up 0.9%, and food away from home rose 0.5%, led by a 0.7% increase in full-service meals. The shelter index rose 0.3%, and BLS says shelter accounted for more than thirty percent of the monthly all-items increase. Within shelter, owners' equivalent rent rose 0.3% and rent rose 0.2%. BLS weights each category by its share of consumer spending, and on those weights shelter, at 35.2% of the basket, added roughly 0.11 percentage points to the headline, food, at 13.4%, added roughly 0.07 points, and energy, at 7.6%, added roughly 0.05 points.
Energy: Smaller Than It Looks
The energy index rose 0.7% after a 5.2% jump in September. The gasoline index rose 1.0% on a seasonally adjusted basis, but before seasonal adjustment gasoline prices actually fell 0.7%. That difference comes from the seasonal factors themselves, because those factors expect gasoline prices to fall in October, so a smaller-than-expected decline shows up as an increase once the adjustment is applied. Electricity added to the energy index with a 0.9% rise.
Chart 2 shows why energy has dominated the headline all year. The energy index swung from a 10.9% jump in March to a 5.7% drop in June, while core CPI stayed between 0.0% and 0.4% every month. October breaks that pattern, because energy rose only 0.7% while food and services did more of the work.
Headline inflation held at 0.4% in a month when gasoline prices fell before seasonal adjustment, and that is the detail that should worry the Fed.
IV.0.296% AGAINST WALLER'S LINE
Core CPI decides December, and on Tuesday morning one Fed governor told markets exactly which core number would change his vote.
Waller's Threshold: 0.3% or More
Waller spoke in London before the data came out. He said he supports a quarter-point hike in December even if October inflation improves, and he said that if core CPI rose around 0.3% or higher, a half-point hike should be considered at the December meeting. Core CPI was then published at 0.3%.
The Rounding Question: Why 0.296% Still Counts
The published figures are rounded to one decimal place, so the unrounded figures come from BLS's seasonally adjusted index levels. Core CPI rose 0.296% from September to October, and headline CPI rose 0.350%, which means the headline only just rounded up to 0.4%. The core figure sits a fraction below 0.30%, but the gap is only 0.004 percentage points. BLS estimates the standard error of a one-month change in the all-items CPI at 0.04 percentage points, ten times that gap, so the rounding argument cannot be used to dismiss the print.
Breadth: What Used Cars Concealed
The used cars and trucks index fell 1.2% after rising 0.7% in September, and that single decline pulled the core reading down. Used cars carry a 2.7% weight in the CPI, and removing them from core with BLS's weights puts the rest of core at roughly 0.35% for the month. BLS's index for all items less food, shelter, energy and used cars rose 0.4%. Traders call services less rent of shelter "supercore," because it isolates service prices that housing and energy do not explain, and supercore rose 0.5% after 0.3% in September. The service categories behind that move were broad.
- Transportation services: The index rose 0.8%, and motor vehicle insurance rose 0.7% within it.
- Recreation: The index rose 0.8% after a 0.5% gain in September.
- Medical care: Hospital services rose 0.8%, and physicians' services rose 0.4%.
Measured over three months, core CPI is now running at an annualized pace of 3.75%.
Chart 3 compares September (hollow circle) with October (solid circle) for each component. Green bars show components that accelerated, and red bars show components that slowed. The long red bar at the bottom is used cars, and nearly everything above it either held steady or moved faster.
The 0.3% core print was the soft version of a hotter report, because one falling used-car index masked broader service inflation.
V.CAN THE OIL CRASH CHANGE DECEMBER?
Markets repriced the Fed within the morning, and the data calendar explains why falling oil prices will not show up in the official inflation data before the Fed votes.
The Repricing: Two-Year Yields Lead
One basis point equals one-hundredth of a percentage point, and bond traders quote yield moves in basis points. By about 10:00 a.m. in New York, the 2-year Treasury yield had risen 19.1 basis points to 4.738%, the 10-year yield had risen 12.9 basis points to 4.992%, and the dollar index was up 0.4%. Part of that move came before the release, when the 2-year yield had already climbed about 6 basis points in early New York trading. The 2-year yield moved most because it tracks expectations for the Fed's policy rate over the next two years.
Fed funds futures are contracts that settle on the average effective federal funds rate for their month, so their prices imply odds for each possible Fed decision. Before the release, CME FedWatch already priced a quarter-point December hike as a certainty and gave a half-point hike only about a 1.4% chance. After the release, the odds of a half-point hike rose to nearly 15%.
The Calendar: November CPI Arrives After the Fed
Brent crude has fallen about 22% from a late-October peak above $117 a barrel and traded below $92 on Tuesday, after President Trump said further strikes on Iran were highly unlikely if a strong agreement is reached. That decline will show up in the November CPI report, which BLS has scheduled for December 10. The Fed's decision comes on December 9, one day earlier.
Apart from the November jobs report due on December 4, the Fed will decide with data that is already published, and each of those releases leans toward tightening.
- October payrolls: Employers added 165,000 jobs against a 65,000 consensus, with 84,000 in net upward revisions.
- October wages: Average hourly earnings rose 0.4% for the month, with unemployment at 4.1%.
- September PCE: The personal consumption expenditures price index is the inflation gauge the Fed targets, and Waller cited headline PCE inflation of 3.7% and core PCE inflation of 3.1% over twelve months.
The cheaper oil that lifted stocks on Monday will reach the official inflation data one day after the December vote.
VI.WHAT THE FED TAKES INTO DECEMBER
The October report answers its own question once the missing base is rebuilt. BLS never collected October 2025 prices, so the official annual rate does not exist, but BLS's own geometric-mean method puts annual headline inflation near 4.0% and annual core inflation near 2.8%, both higher than in September. The 0.4% headline came from food and shelter while gasoline prices fell before seasonal adjustment, and the 0.3% core reading landed on Waller's half-point line, with a 1.2% drop in used cars hiding a 0.5% rise in supercore and a 3.75% three-month core pace. Markets responded with a 19-basis-point rise in the 2-year yield across the morning and nearly 15% odds of a half-point hike, while the oil decline that could cool inflation will not appear in the CPI until December 10, one day after the Fed votes.
That sequence leaves December with a quarter-point hike as the floor and a half-point hike back on the table, and it raises the positioning question for the next four weeks: how to trade the 2-year, the dollar and rate-sensitive equities into a meeting where the oil decline will not yet appear in the official inflation data.
Sources: U.S. Bureau of Labor Statistics, CPI news release for October 2026 and CPI database series CUSR0000SA0, CUSR0000SA0L1E, CUSR0000SASLE, CUUR0000SA0 and CUUR0000SA0L1E; BLS fact sheet "Approximating missing data points"; Reuters via Investing.com on Governor Waller's remarks; TheStreet Pro and Investing.com for CME FedWatch odds and market levels; FinancialJuice for UniCredit's forecast; BLS Employment Situation for October 2026; Federal Reserve FOMC calendar; Saxo for oil; Tickmill for the payrolls consensus.