This is the bond primer series for serious Macro Investors: the fact is most investors watch stocks and only the real professionals watch the bond market react.
Stocks tell you what investors hope will happen.
Bonds tell you what money costs, how much liquidity exists, what the market thinks inflation will do, whether governments can refinance themselves, and how aggressively investors are being paid to take duration risk.
Long before large institutions and hedge funds commit capital, their focus shifts to the bond market to monitor how yields have priced in and influenced global asset valuations. Yield remains the bedrock of macro, unequivocally.
Once you understand the mechanism of the bond market you will know how macro metrics affect the financial universe. You will be able to answer the following questions yourself:
Why does a stronger jobs report sometimes crush technology stocks?
Why can the Federal Reserve cut rates while the 10-year Treasury yield rises?
Why can falling inflation be bullish for bonds but terrible for banks?
Why does a 30-basis-point move in long-term yields suddenly erase hundreds of billions of dollars from equity valuations?Why does everyone panic when Treasury market liquidity disappears?
All of the above questions come from the same mechanism:
the bond market sets the price of time. Everything else gets priced on top of it.
Start With the Simplest Possible Bond
Suppose the U.S. government borrows $1,000 from you for ten years. It promises:
- $40 of interest every year
- repayment of your $1,000 principal at maturity
That is a bond. The $1,000 is the face value. The $40 payment is the coupon. The coupon rate is therefore $40 / $1,000 = 4%. Nothing exotic yet.
The interesting part begins one second after the bond starts trading. Imagine new bonds are suddenly issued at 5%. Nobody rational wants to pay $1,000 for your old bond paying only $40 when a new bond pays $50. So your bond's market price must fall. Maybe buyers are willing to pay approximately $920. Now that same $40 coupon represents a higher return relative to the price paid.
Bond prices fall when yields rise.
Bond prices rise when yields fall.
This inverse relationship is the first piece of the entire machine. But it is only the beginning.
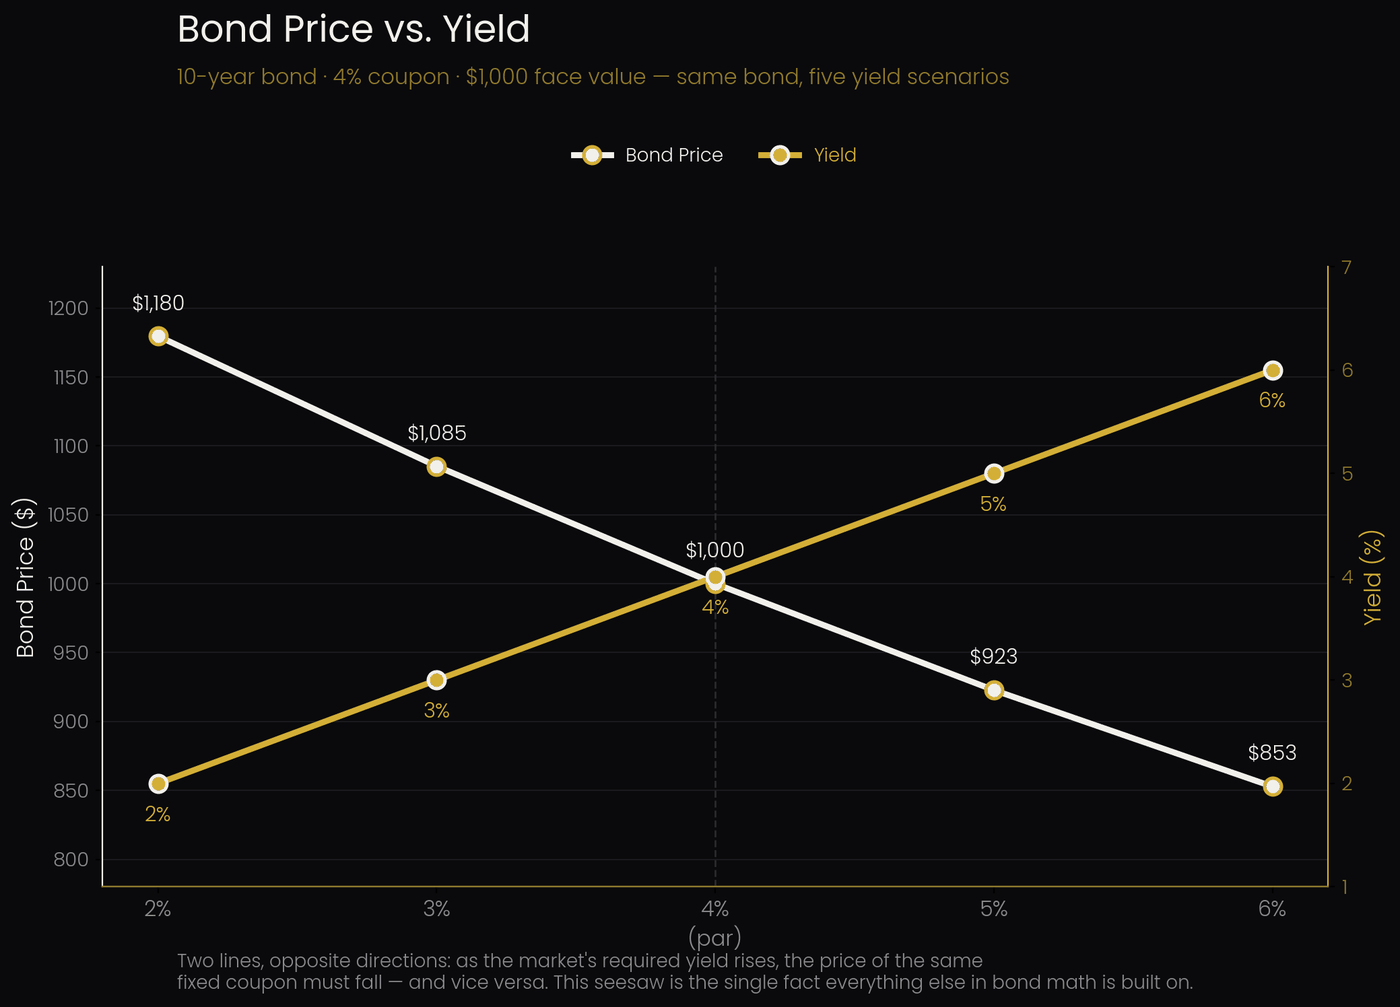
Yields don't rise because a coupon changes — that payout is fixed in stone. Yields shift solely because the market relentlessly reprices the bond.
Coupon Is Not Yield
People casually use “interest rate,” “coupon,” and “yield” as though they were interchangeable. The bond might have a 3% coupon, trade at 92 cents on the dollar, offer a yield around 4%, and have a yield-to-maturity different from its current yield.
The coupon tells you what the bond contractually pays. The price tells you what investors currently think that stream of payments is worth. The yield translates price into an implied annualized return. For most macro analysis, yield is the important variable — because yields are continuously repriced by the market. They contain information.
What Actually Moves Bond Yields?
The easier way to understand nominal government bond yield is:
Nominal Yield ≈ Expected Inflation + Expected Real Rate + Term Premium
For serious investors, long-term yields break down into three core pillars:
Expected inflation — if investors anticipate persistent inflation, they demand higher compensation for locking up capital for ten or thirty years, as future repayments lose purchasing power. Higher inflation expectations naturally push nominal yields higher.
Expected real rate — the baseline return investors require after stripping out inflation, driven by economic growth, monetary policy, savings and investment demand, productivity, fiscal policy, and global capital flows.
Term premium — the extra yield investors demand for bearing the risks of long-term commitment: future Fed policy shifts, surging Treasury supply, volatility, liquidity risk, and fiscal deficits.
This is precisely why a long-term Treasury yield is never just a reflection of “what the Fed will do.” Markets, by nature, always find a way to make things more nuanced than a single data point.
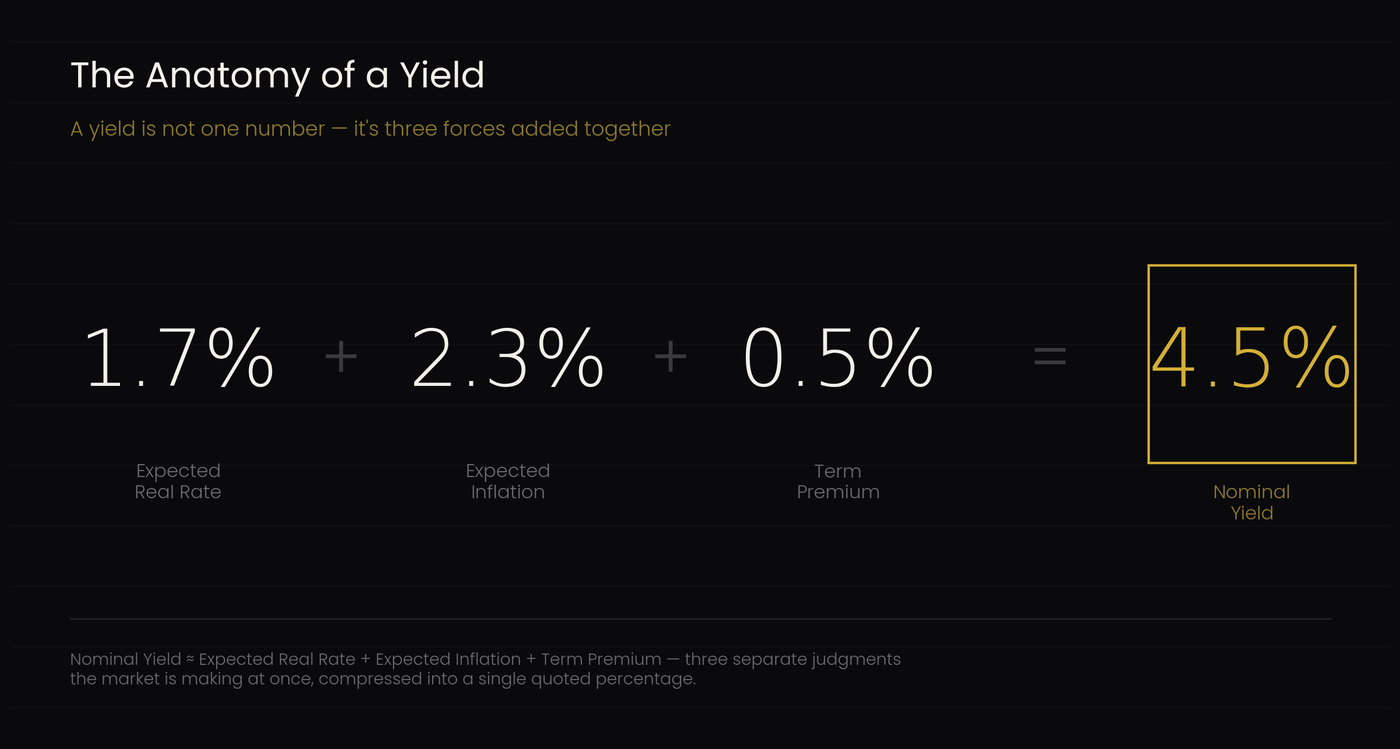
When a yield moves, the first question is never “up or down” — it's which layer moved. A 30bp rise driven by term premium means something completely different from the same 30bp move driven by inflation expectations.
The Fed Controls One End of the Curve
The Federal Reserve directly controls the federal funds target range. That has enormous influence over very short-term interest rates. But the Fed does not mechanically set the 10-year or 30-year Treasury yield — those are market prices.
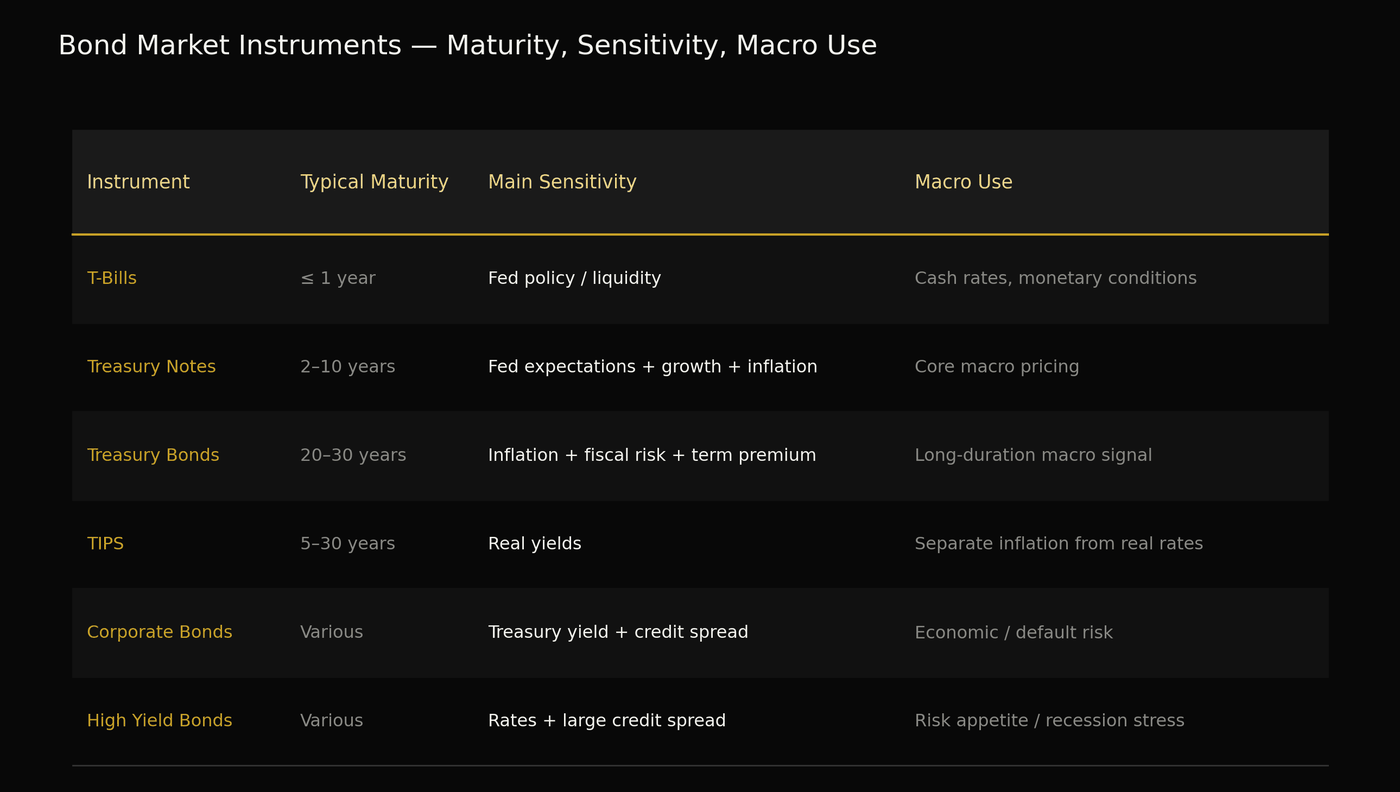
Consider the yield curve: 3-month bill, 2-year, 5-year, 10-year, 30-year. The closer you are to the present, the more directly Fed policy dominates. The farther out you move, the more the market begins pricing future Fed policy, future inflation, growth, fiscal policy, Treasury issuance, and term premium.
That distinction explains something investors repeatedly find confusing: the Fed can cut rates and long-term yields can still rise.
This isn't hypothetical — it has now happened in back-to-back cutting cycles. After the Fed's first cut in September 2024, the 10-year Treasury yield rose by more than 100 basis points over the following months, breaking a pattern that had held through every one of the previous seven Fed cutting cycles since the 1980s, in which the 10-year yield had always been lower 100 days after the first cut. The same divergence showed up again after the Fed resumed cutting in September 2025.
Why? Because near-term Fed cuts reflect slowing growth — normally bullish for bonds — but investors simultaneously priced in sticky inflation, large fiscal deficits, rising Treasury issuance, and growth resilience that outpaced what had been priced in. The 2-year yield can fall because traders expect lower policy rates. The 30-year yield can rise because investors demand more compensation for holding long-term debt and absorbing more supply.
ZMACRO Weekly tracked this exact divergence in real time as it happened — this is the kind of split-curve signal the dashboard in Section 23 is built to catch before it shows up in headlines.
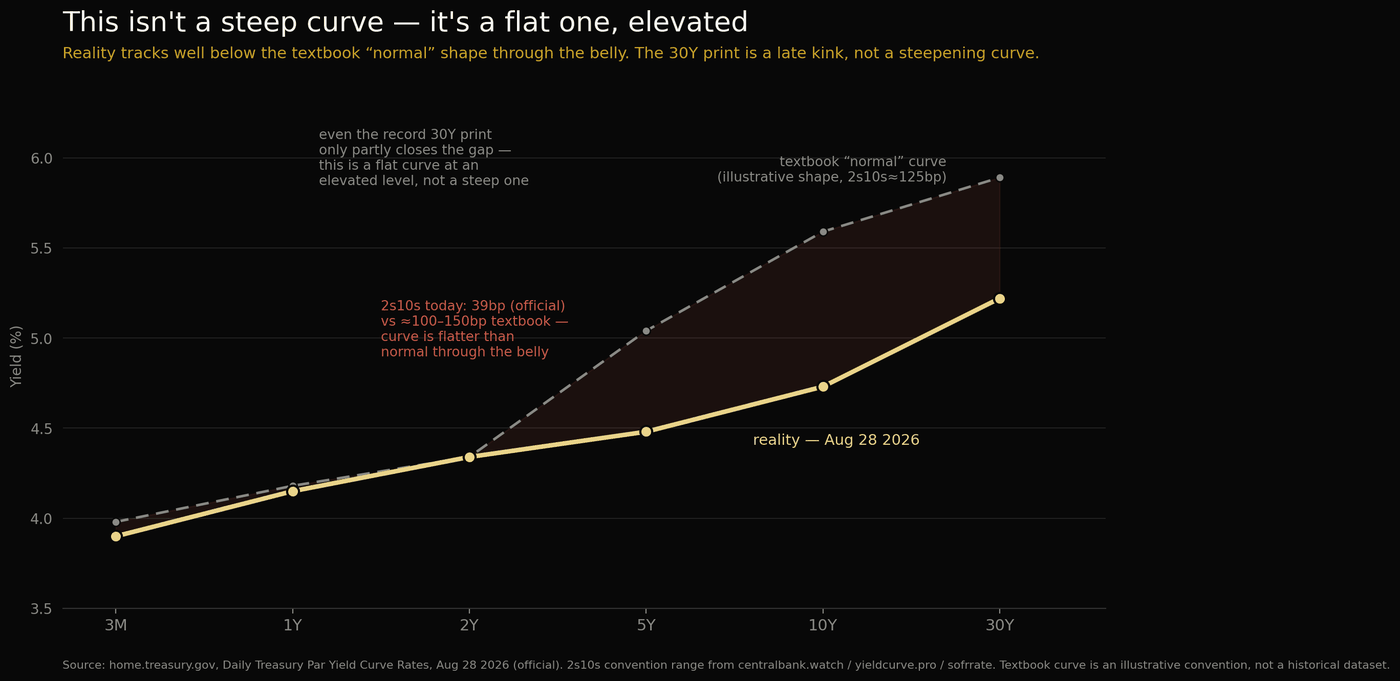
The 2s10s spread is 39bp today — official Treasury data, Aug 28 2026. Textbook “normal” runs 100–150bp. The market isn't pricing a recovery. It's pricing almost nothing, out through 10 years.
THE 30Y PRINT IS NOT A STEEPENING CURVE.
IT'S A LATE-STAGE KINK.
Everything from 3M to 10Y tracks well below where a normal expansion curve would sit. Then, past 10Y, the curve breaks — not because growth expectations changed, but because term premium and fiscal risk finally showed up where duration is longest and nobody else is buying. That's not the yield curve doing its job. That's the yield curve running out of road.
Why the 2-Year Treasury Matters
The 2-year Treasury is extremely sensitive to expectations for Federal Reserve policy. If economic data comes in stronger than expected, markets may conclude the Fed will keep rates higher for longer — the 2-year yield rises. If inflation collapses or employment deteriorates, traders may begin pricing aggressive rate cuts — the 2-year yield falls.
This is why watching only actual Fed meetings leaves you late. Bond traders are constantly pricing what the Fed may do months before the Fed does it.
Why the 10-Year Treasury Matters Even More
The 10-year Treasury yield is arguably one of the most important prices in global finance. It influences mortgage rates, corporate borrowing costs, asset valuations, discount rates, private credit, emerging-market capital flows, currency markets, and equity multiples.
The key reason is discounting. The future dollar is worth less when the risk-free return available today increases. Suppose an asset is expected to generate $100 ten years from now:
- Discounted at 2%: present value ≈ $82
- Discounted at 5%: present value ≈ $61
Nothing about the future cash flow changed. Only the discount rate changed. Yet present value fell by roughly a quarter. Now you understand why high-duration growth stocks can get demolished when long-term yields rise — a technology company with most of its expected profits far in the future behaves, mathematically, much more like a long-duration asset than most retail investors realize.
Duration: The Number Everyone Ignores Until It Hurts
Duration measures how sensitive a bond's price is to changes in yield. A rough approximation:
Price Change ≈ −Duration × Change in Yield
Suppose a bond has a duration of 8. If yields rise by 1 percentage point, price change ≈ −8%. If yields fall by 1 percentage point, price change ≈ +8%. It's an approximation, but it gives you the intuition.
Longer maturity generally means higher duration. Lower coupons generally mean higher duration. Long-duration bonds are leveraged bets on interest rates even when there is no explicit leverage.
This became brutally obvious during the inflation shock. For years, investors had treated long-term government bonds as virtually cash-like. They were dead wrong. The credit risk was negligible; the duration risk was catastrophic — two entirely different animals.
Convexity: Why the Relationship Is Not Perfectly Linear
The duration formula works reasonably well for small yield moves. For larger moves, bond prices do not move in a perfectly straight line — they exhibit convexity. Generally, for a plain vanilla bond: when yields fall, bond prices rise slightly more than duration alone predicts; when yields rise, prices fall slightly less than duration alone predicts. That curvature is convexity.
Duration gives you first-order sensitivity; convexity improves the estimate when yield changes become larger. This distinction matters most in long-duration portfolios and mortgage markets.
Treasury Bonds Have More Than One Risk
People often call Treasuries “risk-free.” That “risk-free” label alone is the biggest risk of all. U.S. Treasuries are generally treated as having negligible default risk in dollar terms — but that does not mean they have no risk. Serious investors need to be familiar with the real risks instead of blindly taking “risk-free” for granted:
- Interest-rate risk — yields rise, bond prices fall
- Inflation risk — the real purchasing power of future payments declines
- Duration risk — long-maturity securities react dramatically to changes in yields
- Liquidity risk — during market stress, even Treasury market functioning can deteriorate
- Reinvestment risk — coupon payments or matured principal may need to be reinvested at lower yields
- Opportunity cost — capital locked into a bond cannot simultaneously earn a superior return elsewhere
“Risk-free” is therefore shorthand for something much narrower: minimal credit/default risk relative to most other assets. Human beings predictably took the shorthand and turned it into theology.
This distinction matters because saying “bonds are selling off” is often insufficient. Which bonds — the 2-year? The 30-year? Investment grade? High yield? Are they inflation-linked? A move concentrated at one maturity can communicate something entirely different from a parallel move across the curve.
TIPS Let You Split Inflation From Real Rates
Treasury Inflation-Protected Securities are designed to compensate investors for inflation. That gives macro traders an extremely useful relationship:
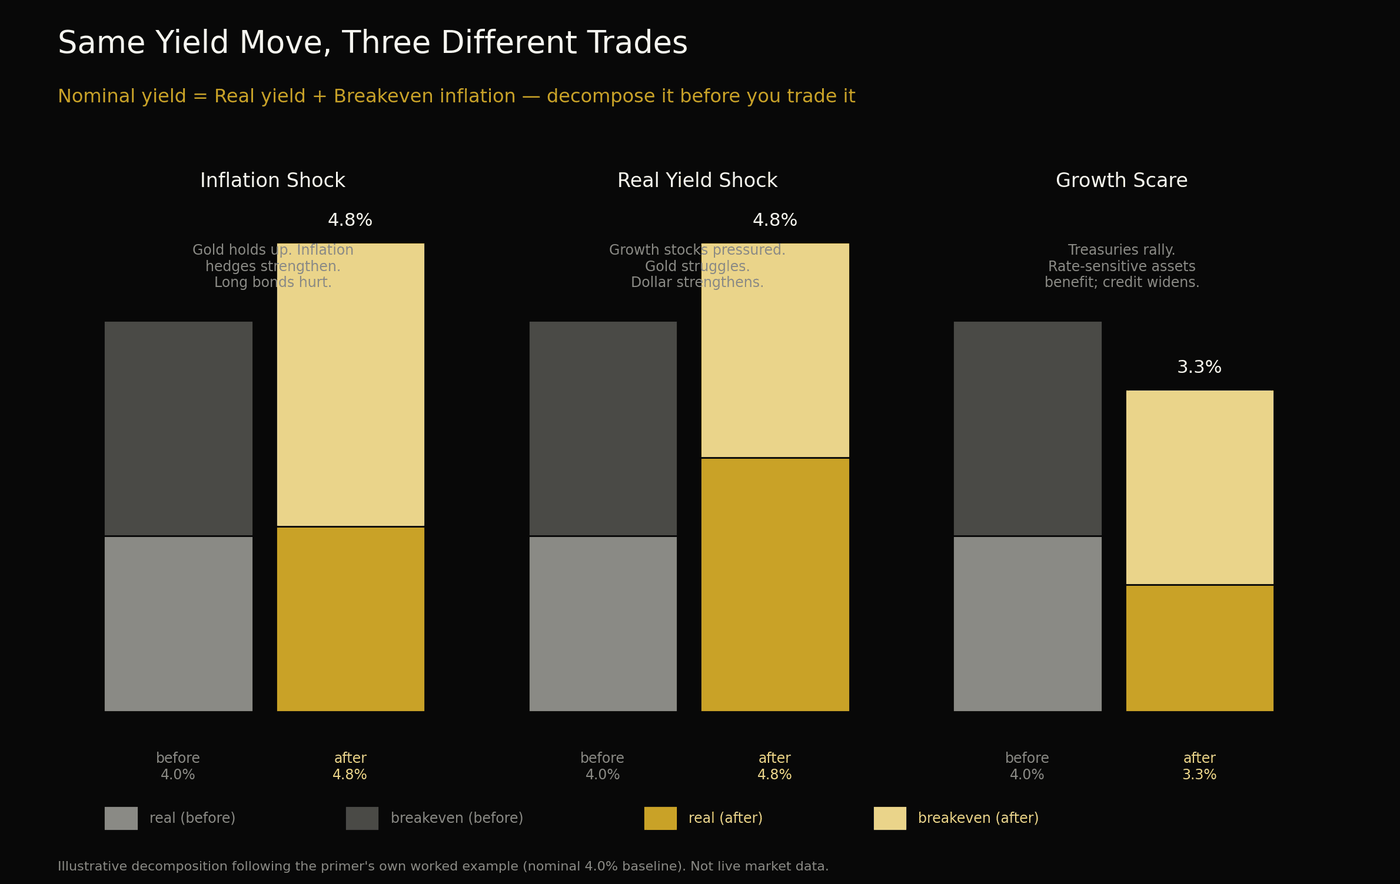
Nominal Treasury Yield ≈ Real Yield + Breakeven Inflation
Example: 10-year nominal yield 4.5%, 10-year real yield 2.1%, so 10-year breakeven inflation = 4.5% − 2.1% = 2.4%. That breakeven is roughly the inflation rate at which investors would be indifferent between a nominal Treasury and an inflation-protected Treasury, subject to various market distortions.
This gives us a diagnostic tool. If nominal yields rise, ask: was it inflation (breakevens rise), or real yields (real Treasury yields rise)? Those two scenarios can have completely different implications for equities, gold, and currencies.
Scenario A — Inflation Shock: nominal 4.0%→4.8%, real 1.8%→1.9%, breakeven 2.2%→2.9%. Most of the move comes from rising inflation expectations. Gold may hold up better; inflation hedges strengthen; long-duration nominal bonds suffer.
Scenario B — Real Yield Shock: nominal 4.0%→4.8%, real 1.8%→2.6%, breakeven 2.2%→2.2%. The entire move comes from higher real yields. Growth-stock valuations face stronger pressure; gold can struggle; the dollar may strengthen; financial conditions tighten sharply.
Scenario C — Growth Scare: nominal 4.0%→3.3%, real 1.8%→1.3%, breakeven 2.2%→2.0%. Markets are pricing weaker growth and easier future monetary policy. Treasuries rally; rate-sensitive assets may benefit initially; credit spreads may widen if recession risk rises.
Credit Spreads: Where Bonds Start Talking About Default
Government bonds are only one part of the market. Corporate borrowers must normally pay more than the Treasury. Suppose the 10-year Treasury yield is 4.0% and a corporate bond yields 5.5% — the credit spread is 150 basis points. That spread compensates investors for default risk, downgrade risk, liquidity, business uncertainty, and leverage.
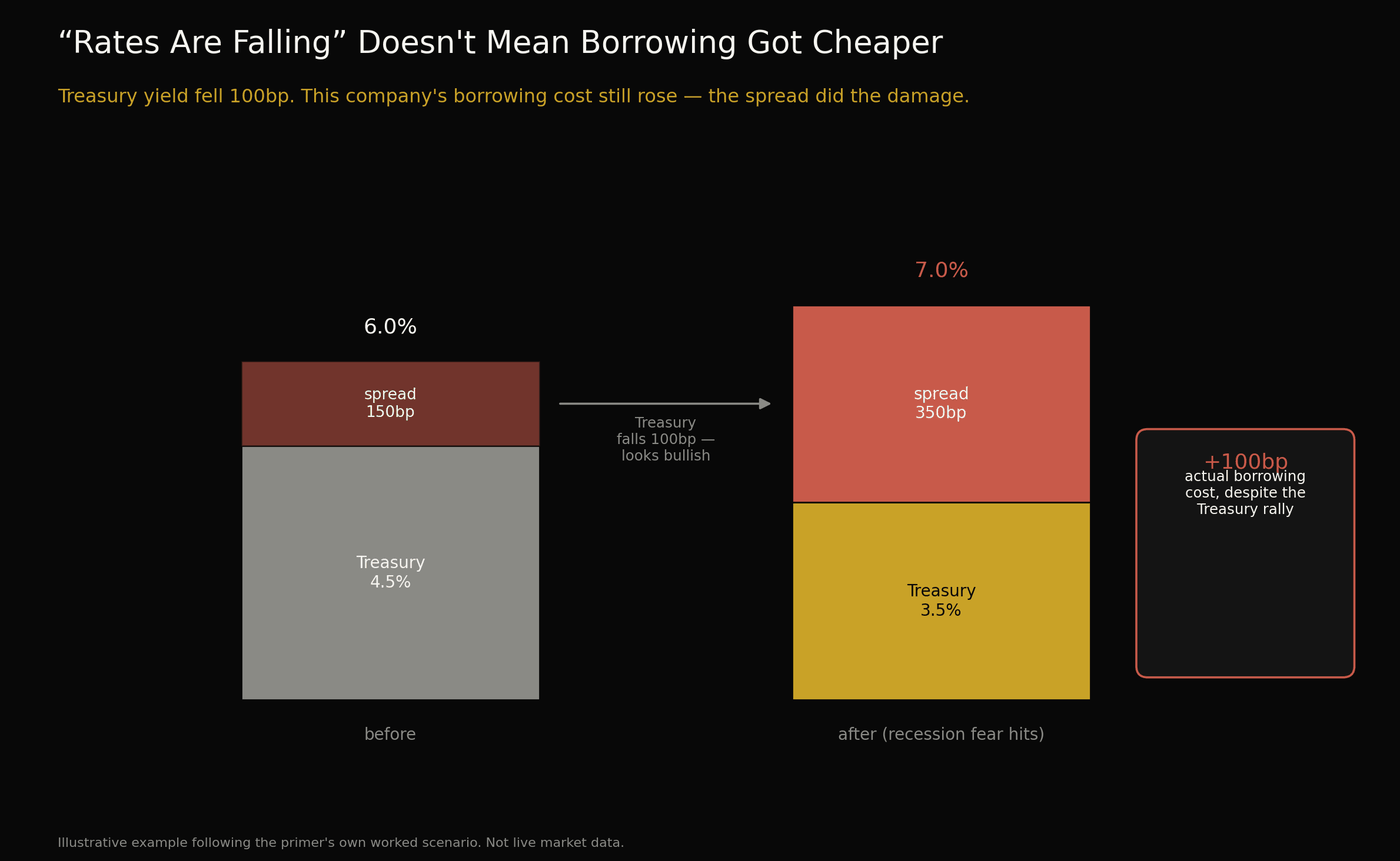
When the economy is strong and investors are confident, credit spreads often compress. When recession risk rises, spreads widen. Take a scenario: Treasury yields fall from 4.5% to 3.5% — on its own, that sounds bullish for corporate borrowers. But if recession fear simultaneously causes a company's credit spread to jump from 150bp to 350bp:
- Old corporate yield: 4.5% + 1.5% = 6.0%
- New corporate yield: 3.5% + 3.5% = 7.0%
Even as Treasury yields fell, the company's borrowing cost rose. That is why “rates are falling” does not automatically mean financial conditions are easing — you must know why rates are falling, and what's happening to the spread on top of them.
The Bond Market Is Also a Supply-and-Demand Market
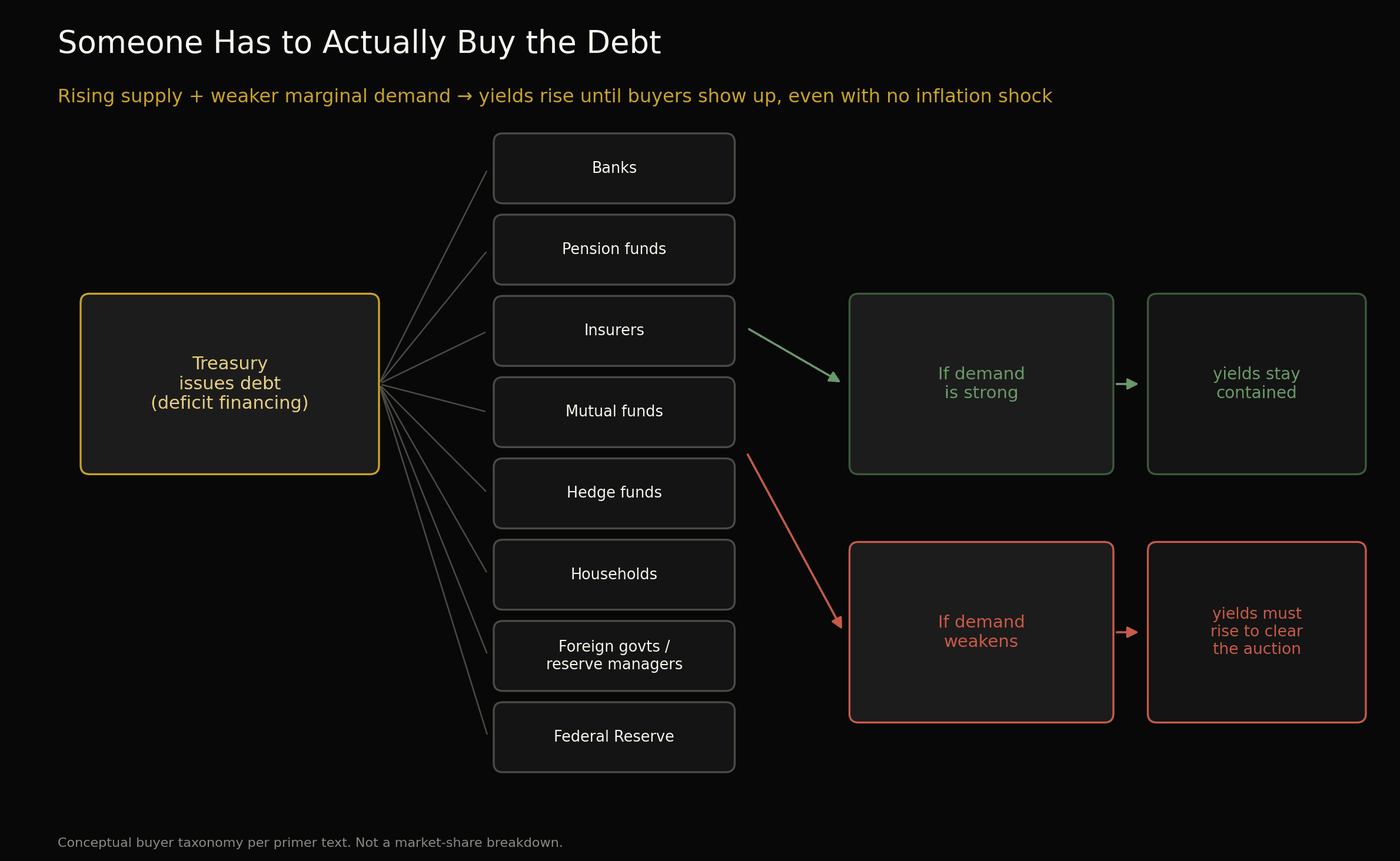
This gets missed constantly. Treasuries are not abstract macro symbols — they are securities that must actually be purchased by someone. The government runs on deficits. The Treasury issues debt. Investors absorb that debt. Potential buyers include domestic banks, pension funds, insurance companies, mutual funds, hedge funds, households, foreign governments, foreign reserve managers, and the Federal Reserve.
If Treasury supply rises aggressively while marginal demand weakens, yields may need to rise until buyers become willing to absorb the additional duration — especially for long-term debt. A government can experience strong downward pressure on bond prices even without an immediate inflation shock. The market may simply demand: pay me more to hold this much duration. That extra compensation shows up partly through the term premium.
Quantitative Easing and Quantitative Tightening
Under quantitative easing, the central bank purchases securities, usually government bonds and sometimes other eligible assets. Mechanically, this increases central-bank reserves, removes duration from private markets, adds a large price-insensitive buyer, and tends to compress yields, term premiums, and financial conditions.
Under quantitative tightening, the central bank allows securities to mature without fully reinvesting the proceeds, or in some cases sells assets. The private sector is forced to absorb a heavier duration load. QT does not automatically trigger a spike in yields, but it removes a primary source of demand — the ultimate impact hinges on Treasury issuance, bank reserves, money-market conditions, foreign appetite, private balance-sheet capacity, and risk sentiment.
QE is never as simple as “printing money and sending stocks up.” Nor is QT merely “deleting money and sending stocks down.” The transmission mechanism runs straight through balance sheets, reserves, duration supply, yields, risk premia, and overall financial conditions.
Why Treasury Auctions Matter
Every time the government issues debt, the market answers a question: at what yield are investors willing to fund the government today? Traders watch the bid-to-cover ratio, indirect bidders, direct bidders, dealer allocation, and whether the auction stops through or tails.
If an auction is weak, dealers may be forced to absorb more inventory — bond prices fall, yields rise. Repeated weakness across long-duration auctions can signal that investors want more compensation for absorbing government debt. This is where fiscal policy enters directly into market pricing.
Banks Live Inside the Bond Market
Banks borrow short and lend long. They collect deposits, issue liabilities, and invest or lend those funds into longer-duration assets. The spread between funding costs and asset yields matters enormously, and rapid changes in rates can create serious balance-sheet problems.
Imagine a bank bought large quantities of long-duration bonds when yields were 1.5%. Rates then rise to 5%. Those old bonds lose substantial market value. If deposits remain stable, the bank may hold them until maturity. But if depositors suddenly withdraw funds, the bank may need to sell assets — paper losses become realized losses, and a liquidity problem becomes a solvency problem.
That is one reason bond volatility can suddenly become a banking crisis. The underlying mechanism is often not mysterious at all: duration mismatch + unstable funding.
Why Bonds Control Equity Valuations
Equity valuation ultimately compares expected future cash flows with the return available elsewhere. The risk-free rate provides the baseline:
Required Return ≈ Risk-Free Rate + Equity Risk Premium
Suppose investors demand a 5% equity risk premium. If the 10-year Treasury yield is 1%, required return ≈ 6%. If the yield becomes 5%, required return ≈ 10%. Future cash flows are now discounted much more aggressively, creating downward pressure on valuation multiples.
This is why the same company can be worth a meaningfully higher earnings multiple in one rate regime and a much lower one in another, without the underlying business suddenly becoming worse. The denominator changed.
Why Bonds Control the Dollar
Currencies are intrinsically tied to relative interest rates. As U.S. yields climb relative to Japanese or European benchmarks, dollar-denominated assets grow more attractive, drawing capital toward higher returns.
Yet the underlying mechanism is what truly dictates market direction. If yields surge because the U.S. economy is exceptionally robust, the dollar typically strengthens. But if yields jump due to mounting concerns over fiscal credibility or entrenched inflation, the currency reaction becomes far more complex. Identical yield movement, entirely different catalyst, completely different trade.
Why Bonds Control Gold
Gold pays no coupon, so the opportunity cost of holding it matters. When real yields rise sharply, an investor can earn a higher inflation-adjusted return on government bonds, and gold becomes relatively less attractive — historically producing an inverse relationship between gold and real yields.
But it is not mechanical. Gold is also influenced by central-bank purchases, geopolitical risk, reserve diversification, dollar movements, inflation expectations, and confidence in sovereign assets. Again: do not trade the variable, trade the mechanism producing the variable.
What an Inverted Yield Curve Actually Means
One of the most abused statements in finance is “the yield curve inverted, therefore recession.” The mechanism is more useful than the slogan.
Suppose the Fed has raised short-term rates aggressively to fight inflation. The 2-year yield rises toward expected policy rates. But investors believe those restrictive rates will eventually weaken the economy — so they expect lower future inflation, slower growth, and future rate cuts. Longer-term yields may stay below short-term yields. The curve inverts.
The inversion isn't magic — it reflects the market pricing a restrictive present and an easier future. Some of the most dangerous moments occur after the curve begins steepening again, because that steepening can happen when markets suddenly price aggressive rate cuts in response to economic deterioration. Not all steepening is bullish.
Four Phrases, One Mechanism
Which maturity is moving, in which direction, and why? Bull Steepener, Bear Steepener, Bull Flattener, Bear Flattener — a nomenclature seemingly engineered to repel civilians. Strip away the jargon and the mechanics are remarkably straightforward:
- Bull = bond prices rise, yields fall.
- Bear = bond prices fall, yields rise.
- Steepener = the spread between long-term and short-term yields widens.
- Flattener = the spread compresses.
The Most Important Bond-Market Question
Whenever yields move, don't just ask “are yields up or down?” Ask:
- Which maturity moved?
- Was the move driven by Fed expectations, inflation, real yields, or term premium?
- What happened to the shape of the curve?
- Did credit spreads move with it?
- Was Treasury supply part of the move?
- What happened to the dollar?
- What happened to liquidity?
That is the difference between watching a price and reading a market.
The Practical Macro Dashboard
You do not need 50 screens. Start with:
- 2Y Treasury Yield — what is the market pricing for Fed policy?
- 10Y Treasury Yield — what is happening to the central global discount rate?
- 30Y Treasury Yield — what is happening to long-duration risk and term premium?
- 2s10s / 5s30s Curve — is the curve steepening or flattening?
- 10Y Real Yield — are financial conditions tightening through real rates?
- 10Y Breakeven Inflation — is inflation expectation responsible for the move?
- Investment-Grade Credit Spreads — is corporate risk rising?
- High-Yield Credit Spreads — is recession/default stress appearing?
- MOVE Index — how volatile is the Treasury market itself?
That set already explains far more about financial conditions than staring at the S&P 500 every fifteen minutes.
The Bond Market's Hierarchy
You can reduce almost the entire subject to this chain:
Inflation / Growth / Fiscal Policy / Monetary Policy → Expected Fed Path + Inflation Expectations + Real Rates + Term Premium → Treasury Yield Curve → Risk-Free Discount Rate → Credit Costs / Mortgage Rates / Currency Flows / Equity Multiples → Financial Conditions → Economic Activity → back into Inflation / Growth / Fed Policy
It is a feedback loop. That is why bonds sit at the center of macro. They are simultaneously an asset, a funding instrument, a policy transmission channel, a discount-rate benchmark, collateral, a liquidity instrument, and an economic signal.
The One Mental Model Worth Remembering
Forget the vocabulary for a moment. Think of a bond as a contract exchanging money today for money in the future. The yield is the market's price for making that exchange.
Once that price changes, the valuation of nearly every other future cash flow changes with it — stocks, real estate, private equity, corporate debt, mortgages, currencies, sovereign financing.
The bond market is not merely another asset class sitting beside equities. It is much closer to the operating system underneath them.
Stocks are the applications people stare at.
Bonds are the infrastructure quietly deciding whether those applications are allowed to keep running.
And when the bond market breaks, everyone suddenly remembers the operating system exists — usually several trillion dollars too late.
ZMACRO Weekly shows you what it's saying right now.
This primer explained why yield moves everything. ZMACRO Weekly is where that framework gets applied — every week, to the actual curve, the actual auctions, the actual credit spreads that are moving markets today. No recap, no theory repeated. Just this week's dashboard, read the way Section 23 taught you to read it.
Get ZMACRO Weekly →