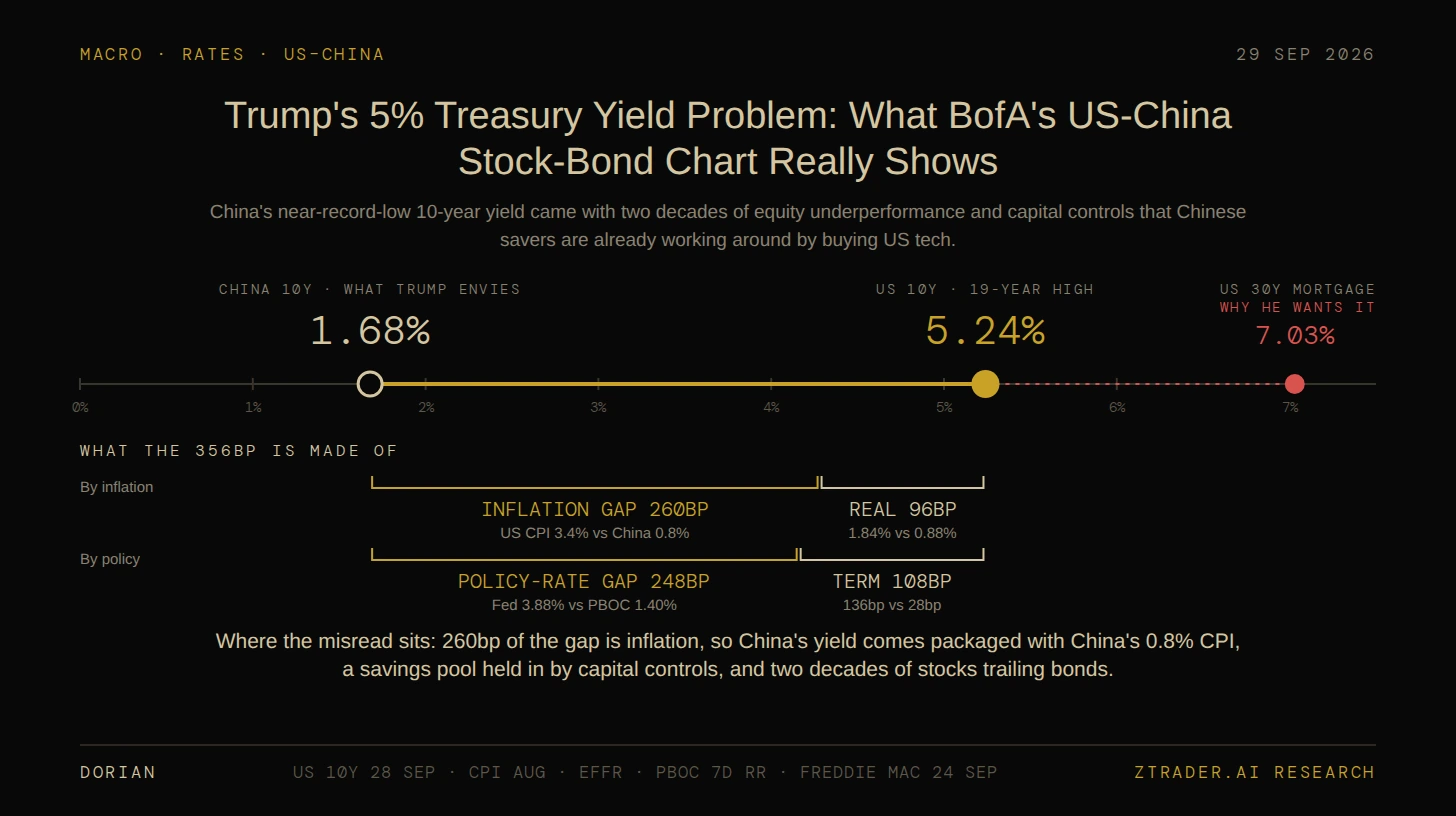
China's near-record-low 10-year yield came with two decades of equity underperformance and capital controls that Chinese savers are already working around by buying US tech.
Macro · Rates · US–China 29 Sep 2026 Trump's 5% Treasury Yield Problem: What BofA's US‑China Stock‑Bond Chart Really Shows China's near-record-low 10-year yield came with two decades of equity underperformance and capital controls that Chinese savers are already working around by buying US tech. DORIAN ZTRADER.AI RESEARCH I. START FROM READING THE BOFA CHART The vertical line in Hartnett’s chart is being lifted by a Treasury selloff as much as by equities, and the low Chinese yields Trump envies are held in place by capital controls that Chinese savers are already queuing to get around. Chart 1 · BofA Flow Show, “China in a Bull Shop” US and China: stocks relative to government bonds, 2004–2026 Dark blue: US stocks ÷ US government bonds (left axis). Light blue: China stocks ÷ China government bonds (right axis). Source: BofA Global Investment Strategy, Bloomberg. Original BofA chart repr
Premium research continues below.
Unlock to read the full report, framework, and trade path.