Order Flow Trading for Beginners: How to Read Footprint Charts, Delta, Volume Profile and the Order Book
Candlesticks compress thousands of trades into four prices, and order flow tools recover the buying and selling that the candle leaves out.
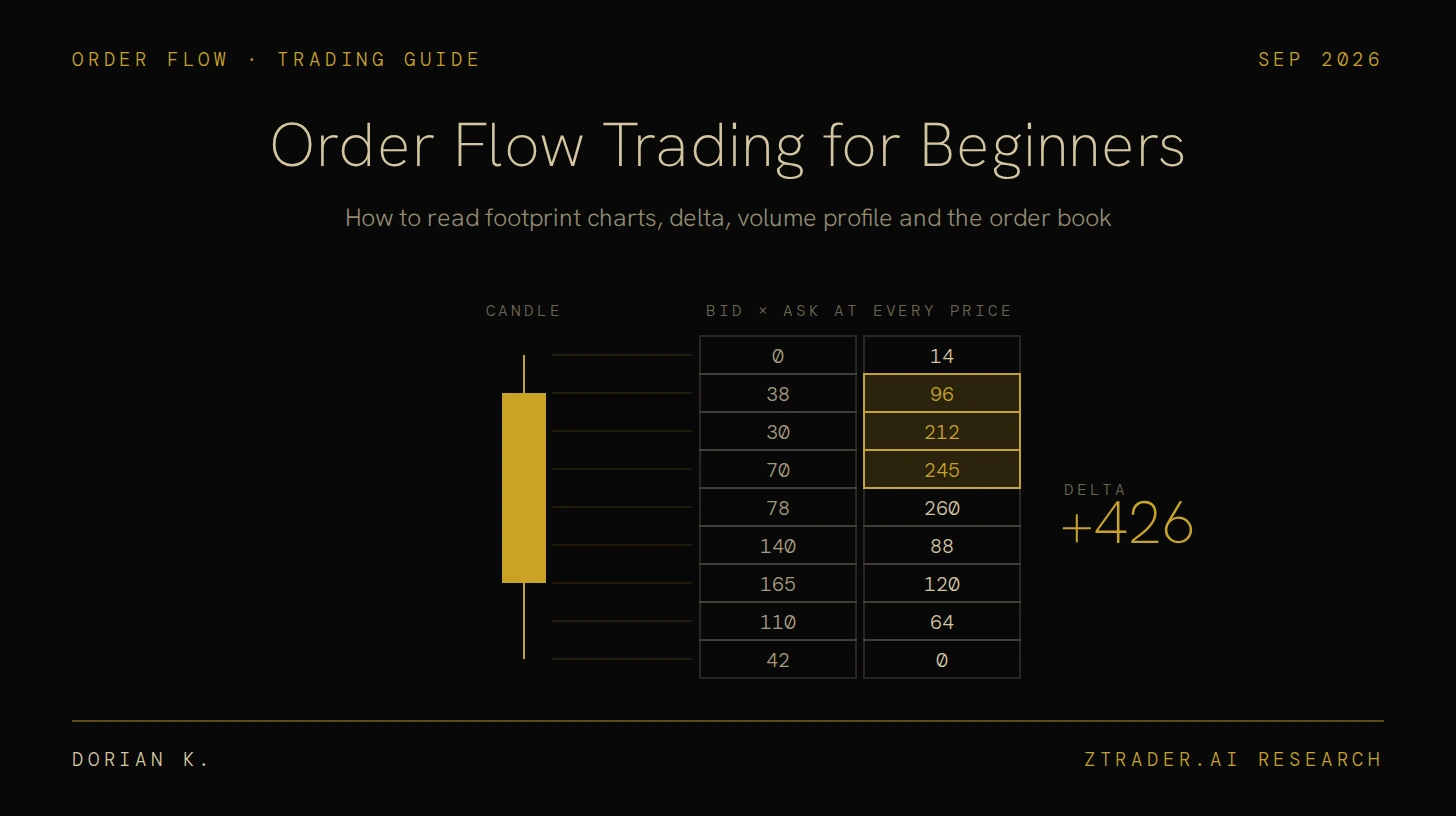
Every candle is a compressed summary of thousands of trades—open, high, low, close—leaving traders trapped in a guessing game of shapes.
Order flow bypasses the shadow entirely, tracking real-time transactions at every price to show who crossed the spread and who blinked first.
It’s the modern evolution of the exchange floor: the tape, the ladder, and the footprint chart laying bare an auction that still runs on raw human behavior just like it did in the pits.
Every Price Move Starts at the Spread
Resting orders and aggressive orders
Every electronic market is made up of passive traders, who post limit orders such as “buy 10 contracts at 5,000.00” and wait in the book for someone to come to them, and aggressive traders, who send market orders or marketable limit orders that execute immediately against whatever size is already resting there.
Passive orders supply the liquidity that aggressive orders consume, and because a trade can only happen when an aggressive order meets a resting one, every print on the tape has exactly one side that paid the spread to get it done.
How the last price actually changes
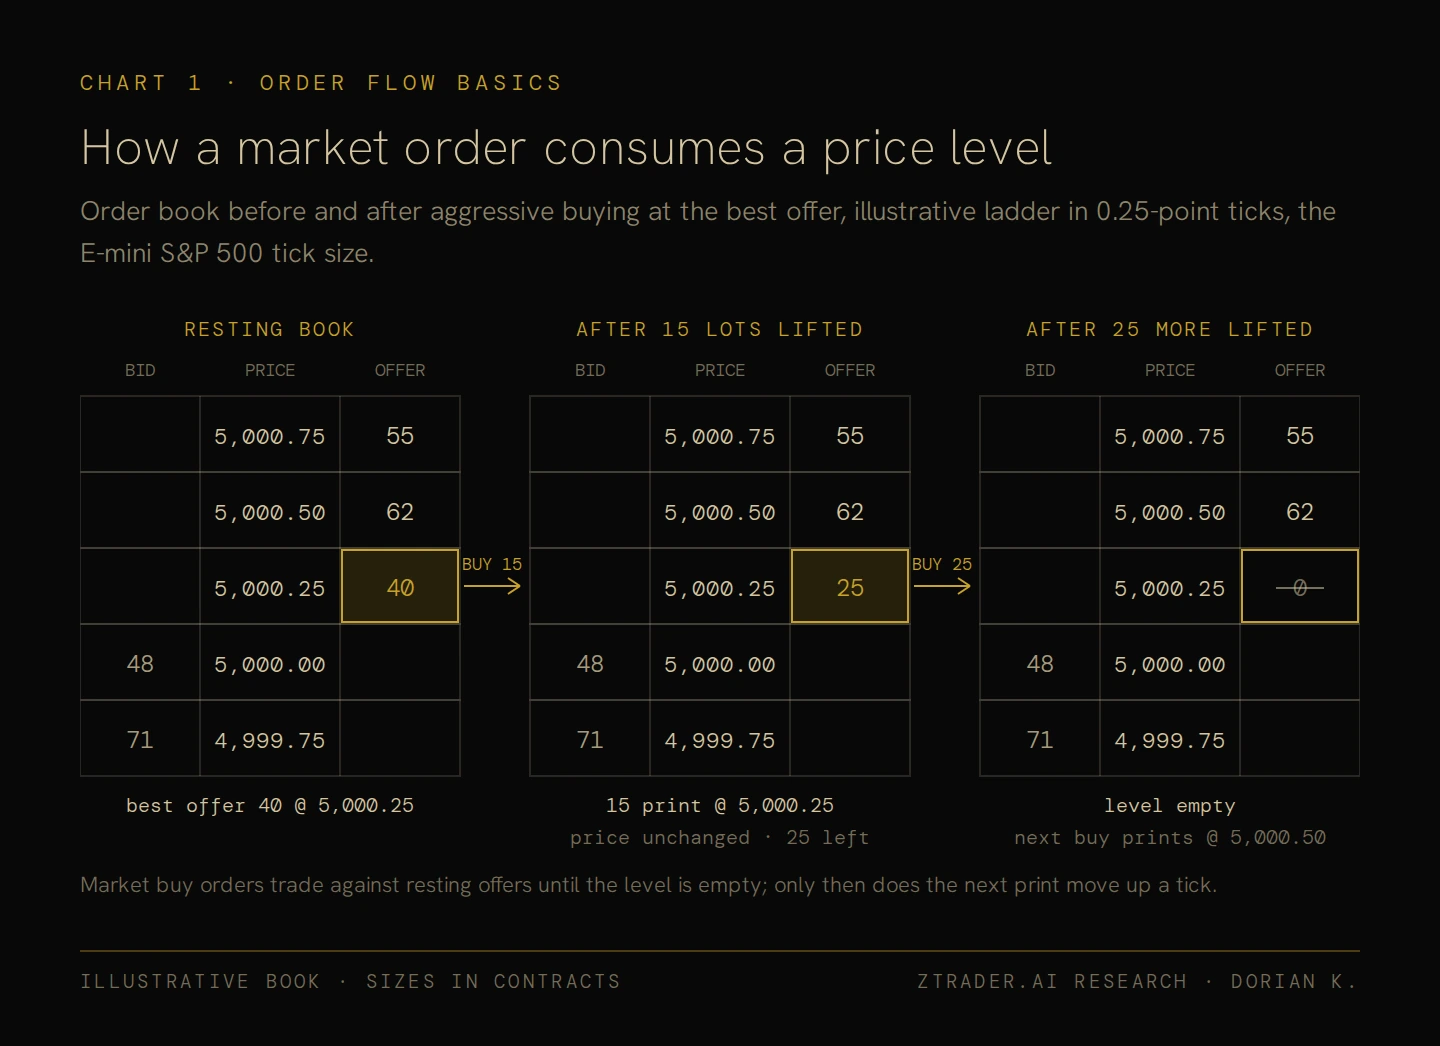
Suppose the best offer is 5,000.25 with 40 contracts resting there: when aggressive buyers lift 15 of them the price stays at 5,000.25 with 25 left, and only after another 25 are lifted and the level is empty does the next buy order have to trade at 5,000.50.
That sequence is the entire mechanism behind a price move, since price changes only when aggressive orders have consumed everything resting at the current level and the next trade has nowhere to print except the next price.
PRICE ONLY MOVES WHEN AGGRESSIVE ORDERS HAVE EATEN THROUGH ALL THE LIQUIDITY RESTING AT A LEVEL.
The opposite case matters just as much, because if sellers hit the bid 900 times while a large passive buyer keeps refilling it, price stays exactly where it is, and that combination of heavy aggression with no movement is information that a candlestick hides completely.
Where the Data Comes From, and Where It Gets Messy
Centralized futures data always give the cleanest feed
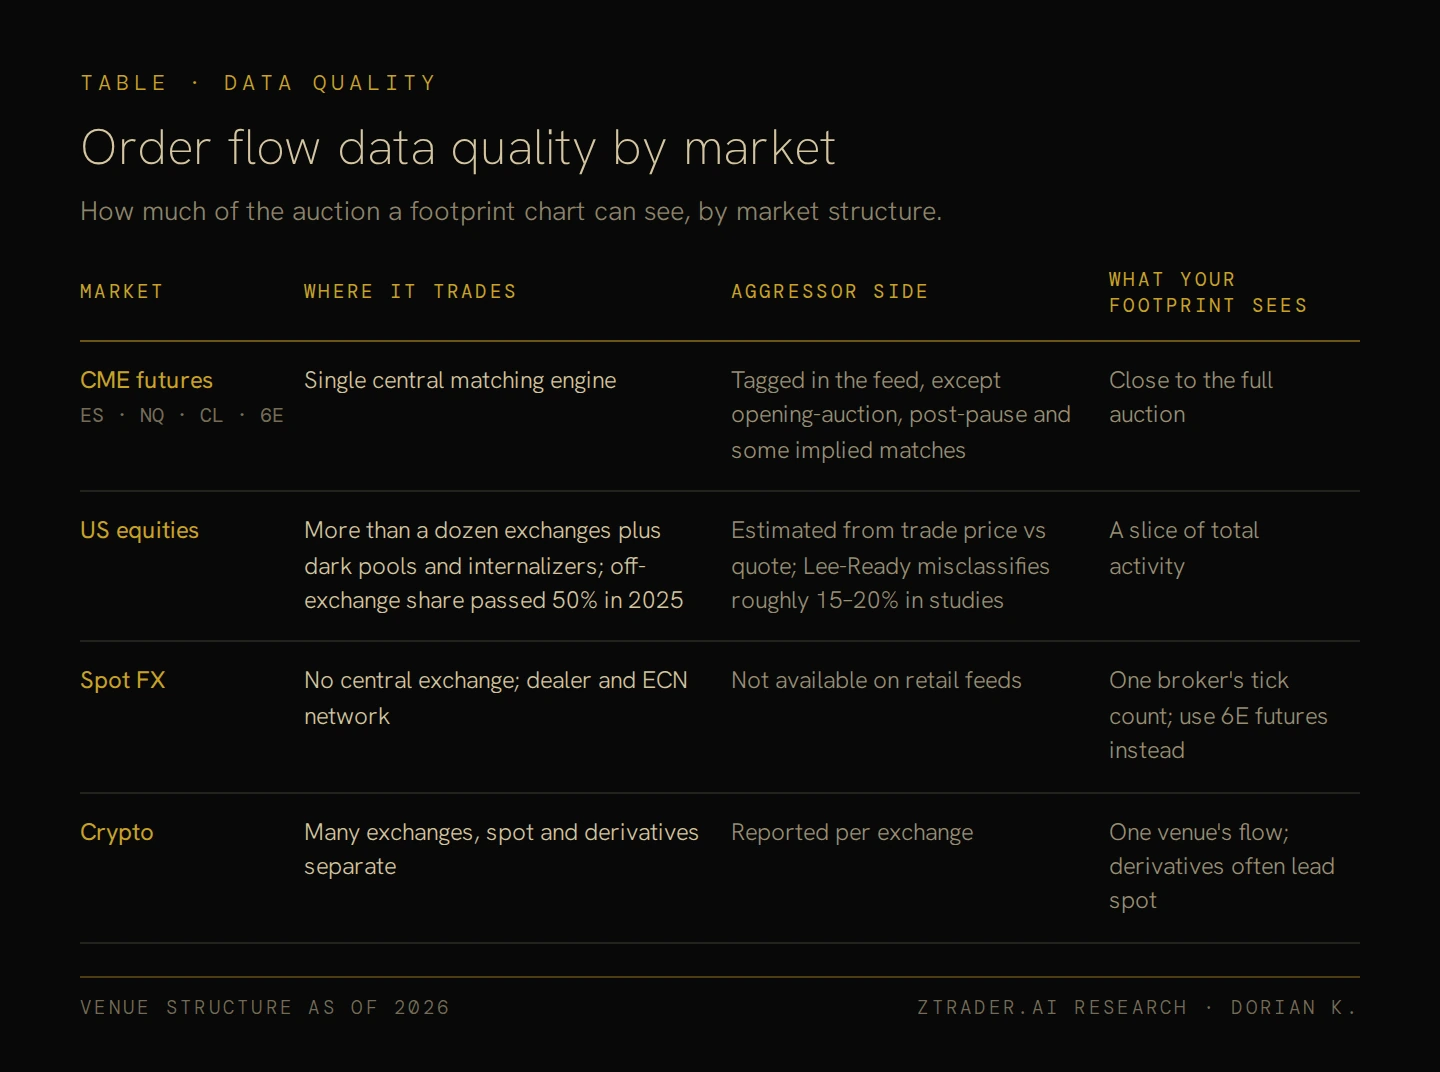
Order flow works best on exchange-traded futures that run through a single matching engine, such as the CME’s E-mini S&P 500 (ES), Nasdaq (NQ), crude oil (CL) and euro FX (6E) contracts, where the exchange feed tags the aggressor side of trades and leaves it blank only for opening-auction matches, trades after a pause and some implied-order matches, so the footprint you see comes close to the full auction, which is the reason most order flow education is built on futures.
Stocks, spot FX and crypto show partial pictures
US equities trade across more than a dozen exchanges plus dark pools and internalizers, and in 2025 off-exchange venues handled slightly more than half of all US equity volume for the first time, which means a footprint on a single stock captures only a slice of the activity, with the aggressor side usually estimated by comparing each trade price with the prevailing quote through the Lee-Ready method that academic tests find misclassifies roughly 15% to 20% of trades.
Spot FX has no central exchange at all, so the “volume” on most retail FX platforms is really a tick count from one broker’s feed, and anyone who wants order flow on the euro is better served reading 6E futures instead.
Crypto data is genuine at the level of each individual exchange, but liquidity is split across many venues and derivatives often lead spot, so reading a single exchange’s footprint on Bitcoin captures part of the market at best.
None of this makes order flow useless outside futures, as long as you know how much of the auction your screen can actually see before you trust what it shows.
Reading the DOM and Level 2 & Resting size at each price
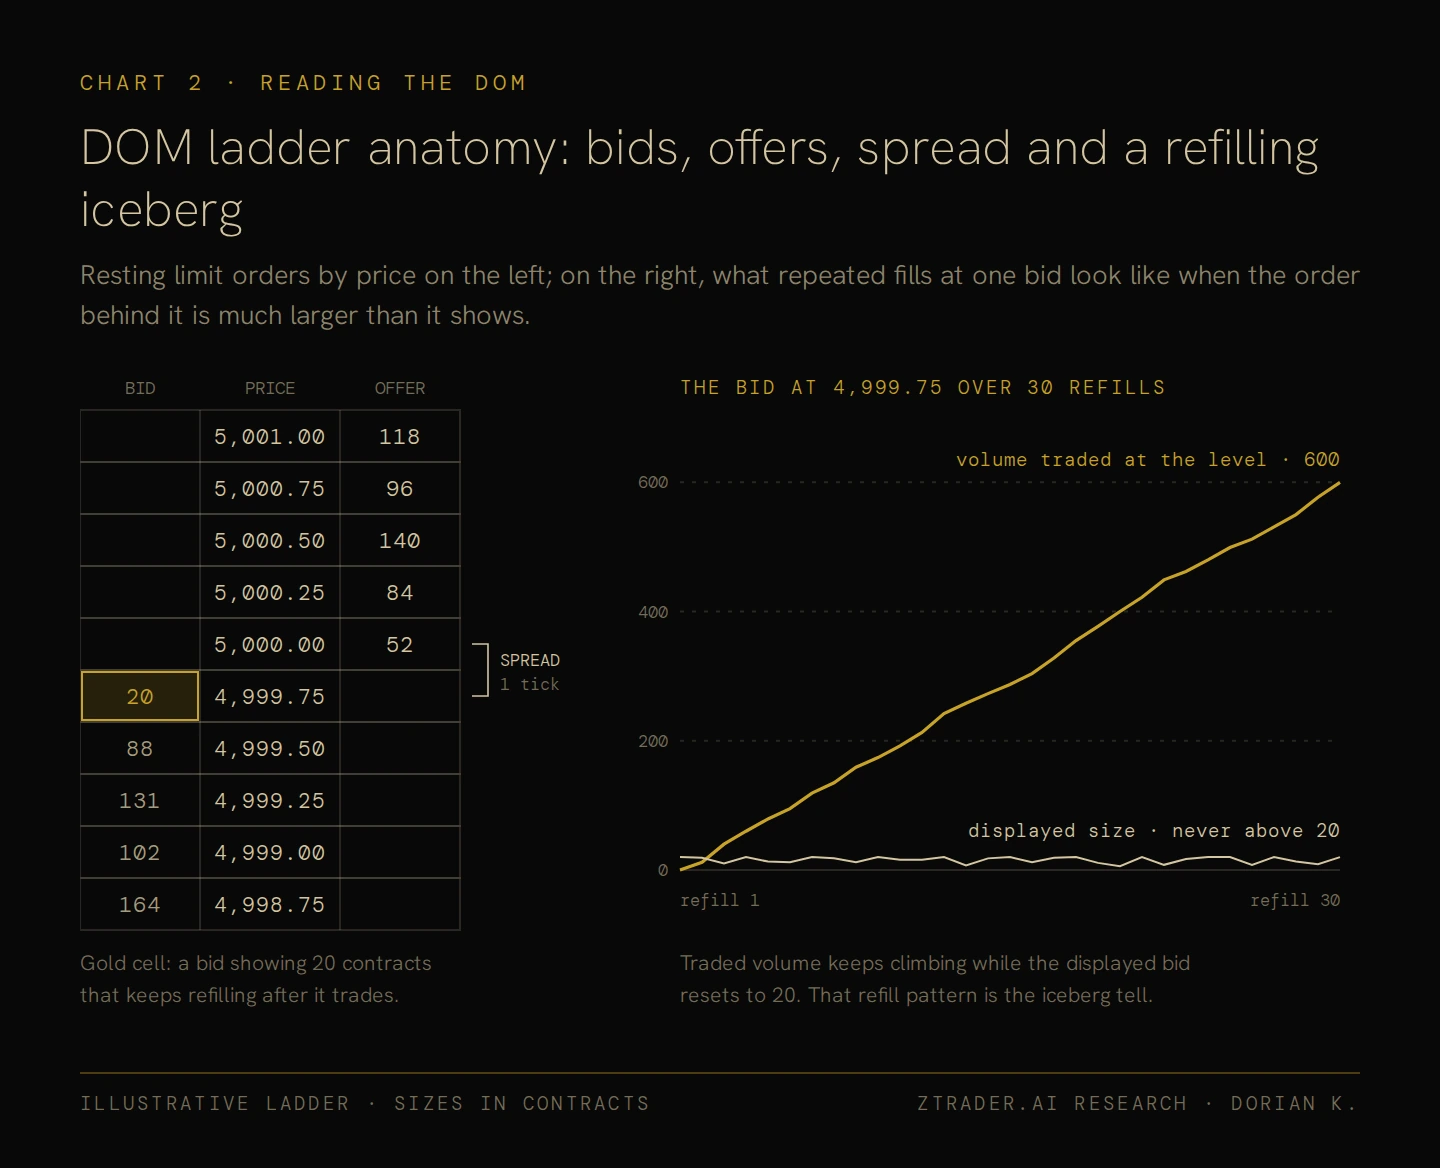
The DOM (depth of market), which traders also call the ladder or Level 2, lists the resting limit orders at each price above and below the market, and new traders often treat any large resting bid as support even though size sitting three ticks below the market is frequently gone by the time price gets there.
Icebergs, pulling, stacking and spoofing
Because resting size costs nothing to cancel, the ladder produces several behaviours worth recognizing, the most basic being pulling and stacking, where liquidity is cancelled or added as price approaches, so that watching whether size holds up under pressure tells you more than the displayed number ever will.
Icebergs are large orders split so that only a small slice shows at any moment, and you can usually spot one when 20 contracts sit on the bid, 600 trade at that price and the displayed 20 keeps reappearing, which is why many platforms now flag suspected icebergs automatically.
Spoofing, which means placing orders you intend to cancel before execution in order to push other traders into trading, is illegal in US futures markets under the anti-spoofing provision the Dodd-Frank Act added to the Commodity Exchange Act, and Navinder Sarao, the London trader linked to the 2010 Flash Crash, pleaded guilty in 2016 to spoofing E-mini futures, which is a useful reminder that some of the size on any ladder is there only to be pulled.
Time and Sales, the Original Order Flow Tool
What to watch in the prints
Time and sales lists every trade with its timestamp, price, size and whether it went through at the bid or the offer, and before footprint charts existed, reading this stream by eye was the entire job of an order flow trader.
The first thing to watch is pace, since a tape that suddenly speeds up usually means somebody needs to get in or out immediately, and after that it helps to notice repeated large lots at a single price, which usually point to one participant working a big order through the market.
Context decides what any of those prints mean, so large lots hitting the bid while price holds its level describe a very different session from the same lots hitting the bid while price falls through level after level, and most traders today use the tape mainly to confirm what the footprint has already summarized.
How Footprint Charts Open Up the Candle
The bid x ask layout
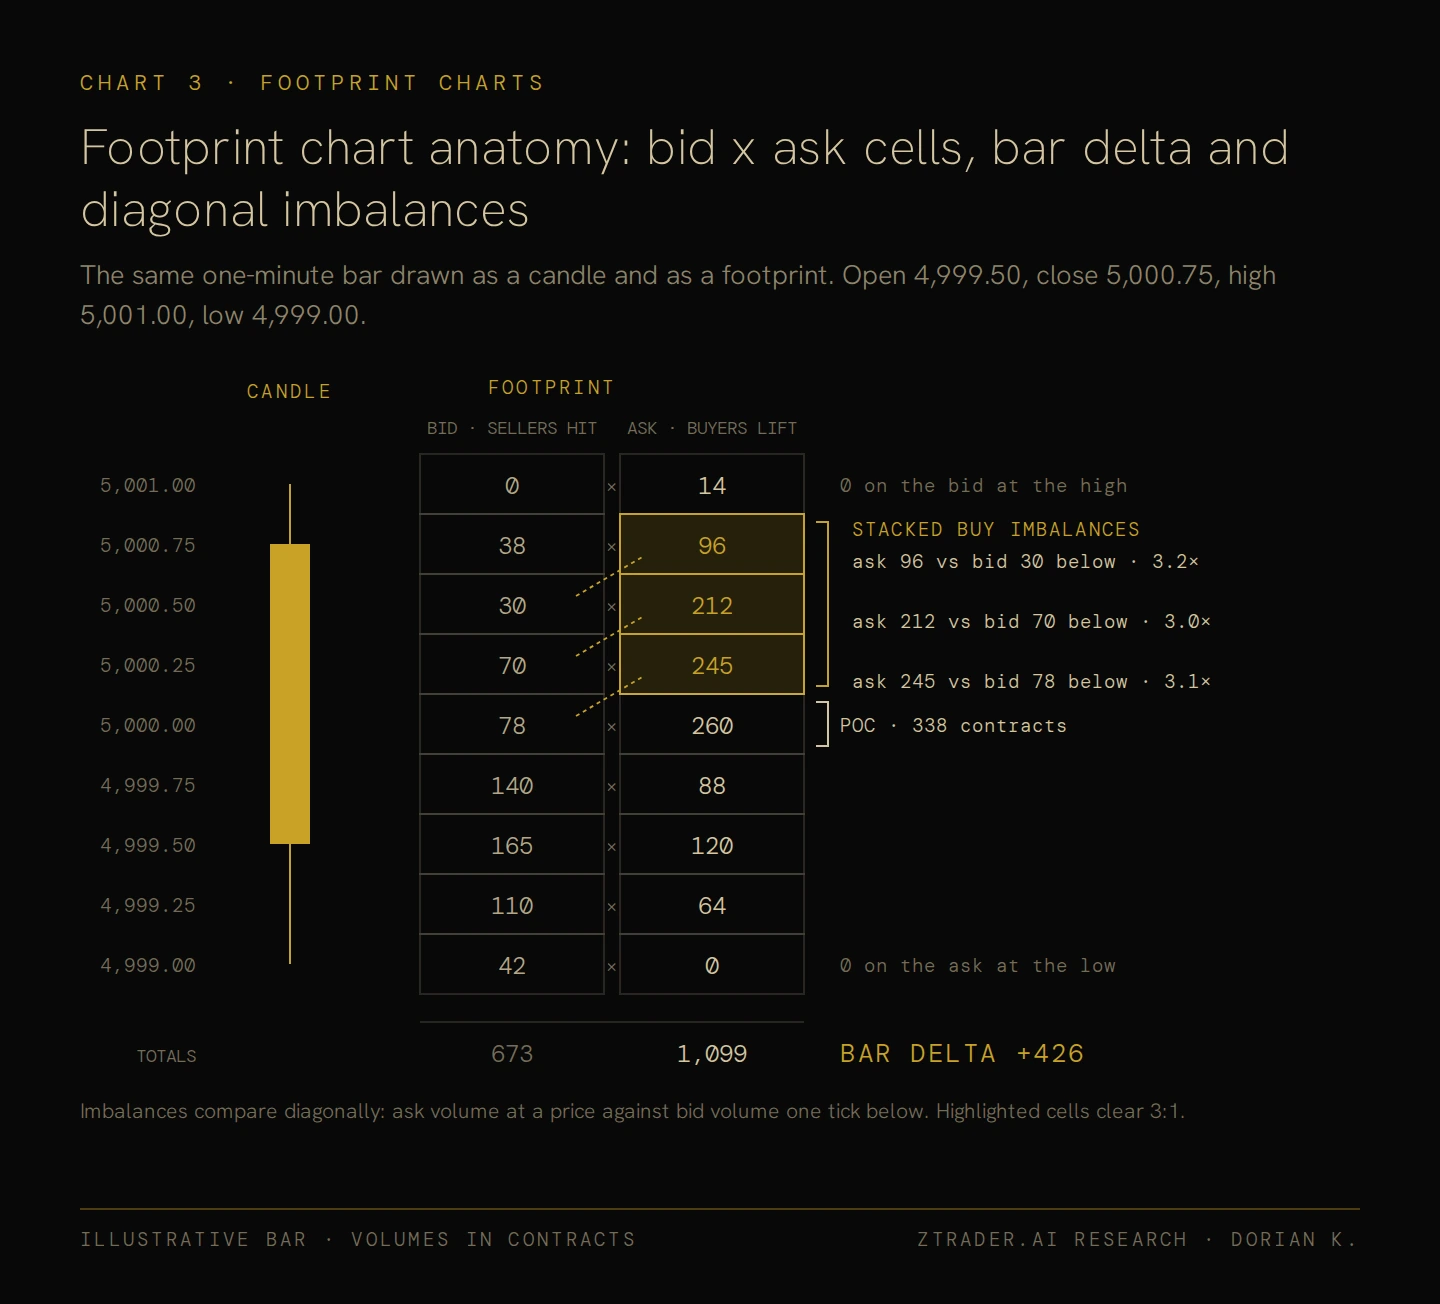
Footprint charts split each bar into its individual price levels and show two numbers at every price, the volume traded at the bid by aggressive sellers and the volume traded at the ask by aggressive buyers, so a level reading 312 x 145 means that 312 contracts were sold aggressively into resting bids at that price while 145 were bought aggressively from resting offers.
Where a candle can only record that a bar closed higher, the footprint shows whether buyers actually drove it up or whether sellers simply stopped showing up and let it drift.
Delta per bar
Delta is ask volume minus bid volume, or aggressive buying minus aggressive selling, so a bar with 4,200 contracts at the ask and 3,100 at the bid carries a delta of +1,100, and a positive reading tells you buyers were the more aggressive side even though price can still fall afterwards, which is exactly the gap between aggression and outcome where the most useful signals come from.
Imbalances and stacked imbalances
Footprints are read diagonally, because a buyer lifting the offer at price P is trading against sellers resting one tick above the bid, so the standard comparison puts ask volume at P against bid volume one tick below, and when one side outweighs the other by a set ratio, commonly 3:1 (displayed as 300%), the platform highlights the level as an imbalance, although defaults vary between platforms and ATAS, for example, ships at 150%, so it is worth checking your own settings.
Isolated imbalances are common and mean little on their own, but when they appear on consecutive levels on the same side, usually three or more in a row, traders call the result a stacked imbalance, and those zones often act as support or resistance on a retest because they mark the prices where one side attacked across several levels at once.
Delta, Cumulative Delta and Divergence
From bar delta to CVD
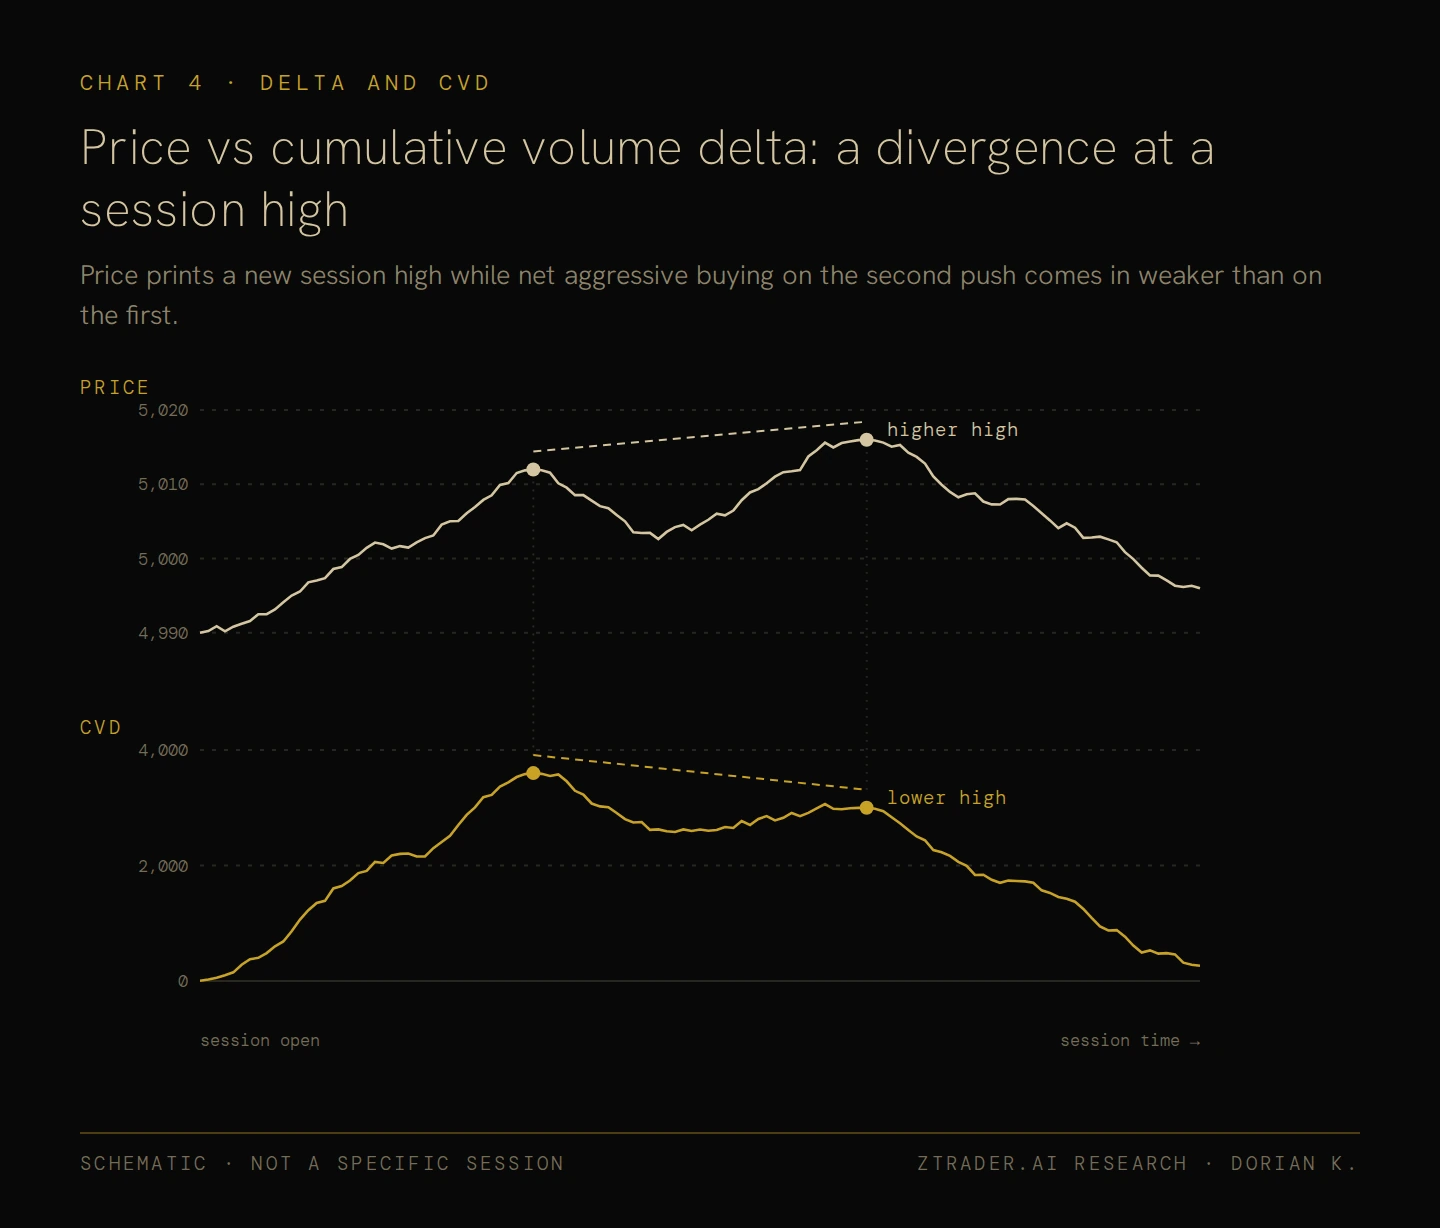
Cumulative volume delta (CVD) adds bar deltas together through the session to produce a running line of net aggression, and when price and CVD rise together it means buyers are pushing and price is responding, which is what a clean trend looks like underneath.
When aggression and price disagree
Divergence is where CVD becomes useful, and the classic case is a new price high printed while CVD makes a lower high, which tells you buyers pushed less on the second attempt and price may have got there only because sellers pulled their offers, so a new high built on weaker aggression deserves suspicion.
The mirror case appears when CVD drops sharply as sellers keep hitting bids while price holds flat or even ticks higher, which means some passive buyer is taking everything being sold at that level.
LARGE DELTA THAT PRODUCES NO PRICE PROGRESS IS A WARNING SIGN WHICHEVER DIRECTION IT POINTS.
CVD also drifts over longer periods because of trade-classification quirks and differences in who tends to use market orders, so it should be reset every session or read over short windows, since comparing today’s CVD with last month’s tells you very little.
Volume Profile Gives You the Map
POC, value area, high and low volume nodes
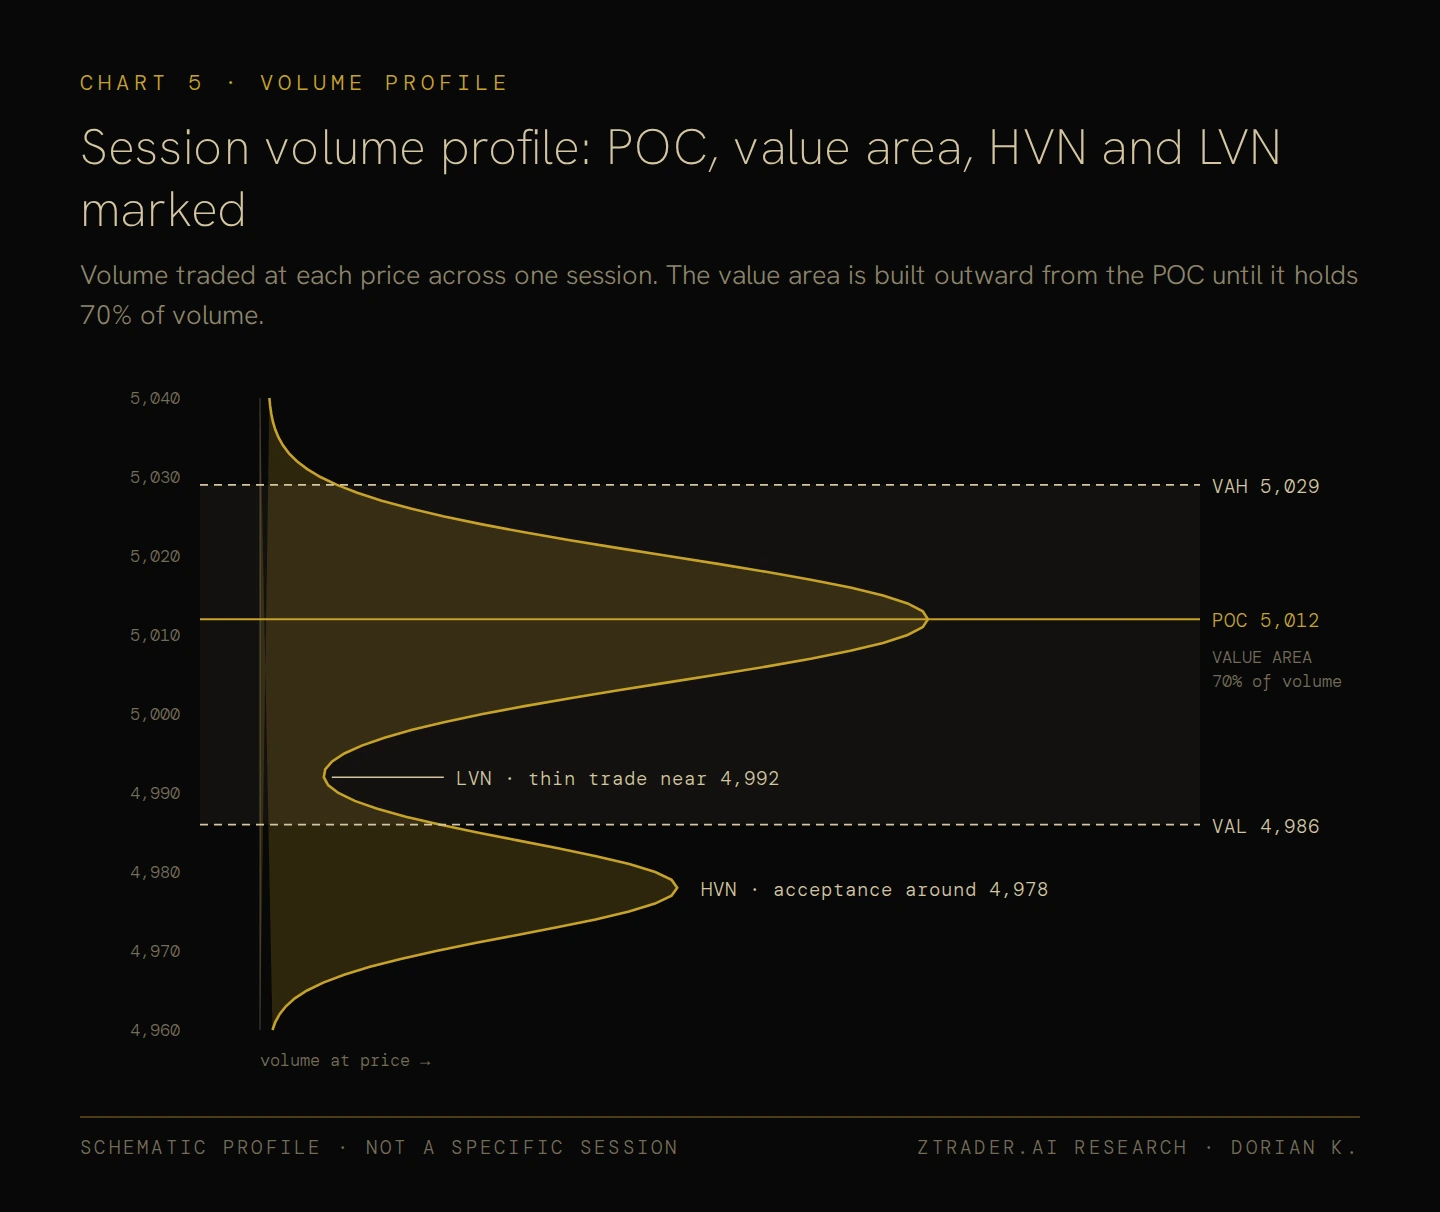
Footprints describe what happens at a single price, and volume profile complements them by showing which prices matter in the first place, using a horizontal histogram of the volume traded at each price over a chosen period such as a session, a week or a trading range.
The most important reference on the profile is the point of control (POC), the single price with the most volume and therefore the fairest price of the period, which sits inside the value area, the range containing roughly 70% of the volume and bounded by the value area high (VAH) above and the value area low (VAL) below.
Thick areas of the profile, known as high volume nodes (HVN), mark prices where trading built acceptance and where price tends to slow down and rotate, whereas the thin areas known as low volume nodes (LVN) mark prices the market moved through quickly and tends to move through quickly again, or to reject at their edge.
VWAP as the session reference
Volume-weighted average price (VWAP) is the average price paid since the session opened, weighted by volume, and because institutions benchmark their execution against it, VWAP draws real flow, so price holding above VWAP with rising CVD describes a very different session from price holding above VWAP while CVD falls.
Why location comes before the signal
Footprint signals that appear in the middle of a range carry very little weight, but the same absorption appearing at the prior day’s value area high, at the edge of an untested LVN or at the overnight low carries far more, because the level gives the footprint something to confirm.
ALWAYS CHECK WHERE PRICE SITS ON THE MAP BEFORE YOU START READING THE FOOTPRINT.
Patterns Worth Learning Before Anything Else
Absorption at a level
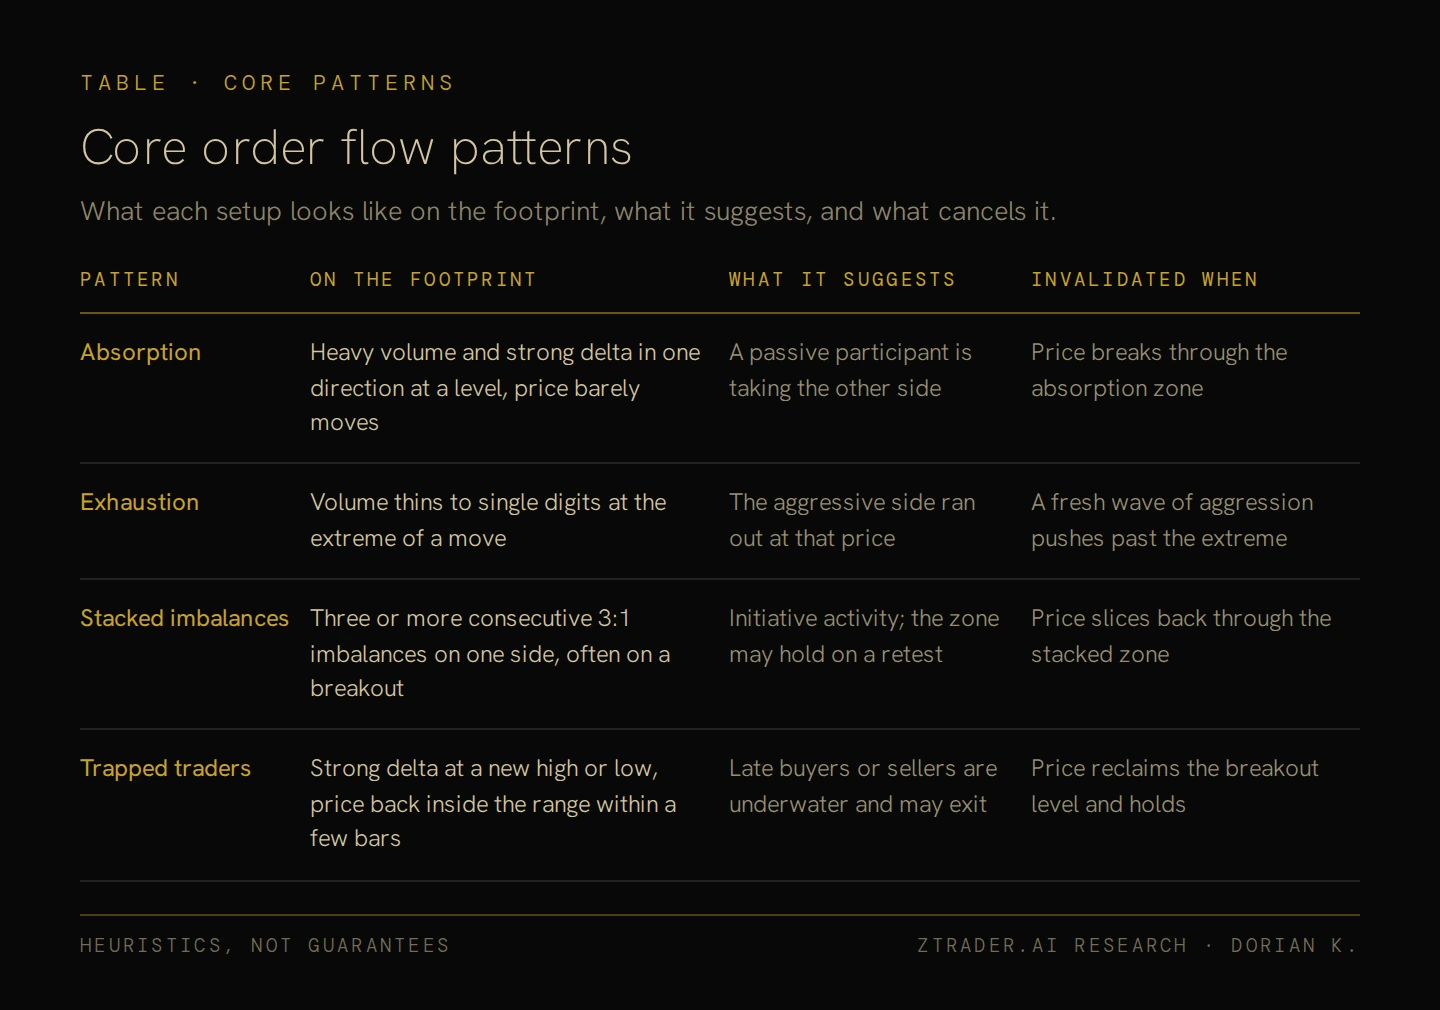
Absorption shows up when price reaches support and sellers hit the bid heavily, printing large bid volume and strongly negative delta across several bars while the lows hold within a tick or two anyway, because a passive buyer is absorbing the selling, and once the aggressive sellers stop, price lifts and the shorts who sold into the level find themselves underwater, with their stops adding fuel to the move.
Exhaustion at an extreme
Exhaustion is quieter, appearing at the tip of an extended move when the footprint at the bar’s high shows single-digit numbers on the ask after hundreds of contracts traded at the levels just below, which tells you nobody was left willing to pay up and that the heavy volume is simply missing instead of being soaked up.
Initiative and stacked imbalances
When price breaks out of a range with stacked buying imbalances, positive delta and expanding volume, traders call it initiative activity, meaning one side has rejected the old range, and the stacked zone then becomes the level to watch on the first pullback, since buyers defending it make continuation more likely and price slicing back through it marks the breakout as failed.
Trapped traders and failed auctions
Failed moves often produce the cleanest trades, as when price breaks a high, aggressive buyers pile in with strong positive delta, and within a few bars price is back inside the range, leaving those buyers holding losing longs near the top where their exits push price lower still.
Unfinished auctions are a related heuristic that applies when the extreme of a bar shows volume on both the bid and the ask instead of zero on one side, which suggests price is likely to revisit that level, although it should be treated as a tendency and nothing firmer.
How to Build an Order Flow Routine
Before the session opens
Pick one liquid futures contract such as ES, NQ, CL or 6E and stay with it, because each contract has its own rhythm, typical size and speed, and spreading your attention across several of them slows down learning in all of them.
Before the open, mark the reference levels you intend to trade from, including the prior day’s POC, VAH and VAL, the overnight high and low, the weekly value area where it is relevant and any obvious LVNs from recent profiles, and treat those places as the only locations where trades are allowed to come from.
Fix your footprint settings before the session starts as well, choosing a bar type (time, range and volume bars all work), a tick aggregation that keeps the numbers readable and an imbalance ratio, commonly 300%, and then leave them alone, since adjusting settings mid-session is how traders talk themselves into signals that are not there.
When price reaches a level
Most of the session is spent waiting for price to trade into one of your marked levels, and that waiting is the discipline beginners skip first.
Once price arrives, read how the auction reacts by looking for absorption, exhaustion, stacked imbalances pushing through or delta diverging from price, and then check the DOM for size holding or pulling and the tape for urgency before deciding anything.
Build the trade around the evidence you actually saw, so that for an absorption long at support the stop belongs beyond the absorption zone, because a break through the level where passive buyers were defending destroys the premise of the trade, and the target comes from the map, whether that is VWAP, the POC or the far edge of value.
After the trade
Screenshot the footprint at entry and at exit and write down what you saw and what followed, because after a few hundred logged setups you will know whether your read of absorption actually holds up or whether you have been matching noise.
All of this should happen on market replay before you risk money, and Sierra Chart, ATAS, Bookmap, Jigsaw and NinjaTrader’s order flow tools all offer historical replay, where a replayed session costs you nothing more than data fees.
Mistakes That Burn New Order Flow Traders
Reading every number on the screen
Footprints print hundreds of numbers a minute and most of them record routine two-sided trade, so the useful information sits in the handful of levels where something unusual happened at a location that matters.
1. Trusting displayed size over traded volume
Resting orders can be cancelled in milliseconds whereas executed volume is permanent, so whenever the DOM and the footprint disagree, the footprint deserves more weight.
2. Treating delta as direction
Delta identifies which side was aggressive without telling you whether that aggression worked, which is why strong positive delta at a new high can simply mean buyers are walking into a trap, and the only way to tell the difference is to watch how price responds afterwards.
3.Forgetting who else is trading
Much of futures volume is algorithmic, coming from market makers, execution algorithms slicing large orders and high-frequency firms that see the same book you do but faster, so order flow improves your read of the auction without giving you any speed advantage over co-located firms, and whatever edge you find will come from context and patience at your levels.
4. Skipping the higher timeframe
Clean absorption against a strong daily trend is still a countertrend trade, which is why it pays to know the larger picture before a one-minute footprint argues you into a position.
What Order Flow Can Realistically Do for You
Order flow won't predict the next candle—no tool does.
What it does is replace guesswork with evidence. Instead of debating whether a level should hold, you watch whether it is holding, contract by contract: seeing buyers burn out before the candle flips red, or a passive wall absorb a rally that looked unstoppable on a line chart.
The practical playbook starts with a single market, key levels mapped in advance, where you let price come to you and judge each footprint by the raw numbers it prints